
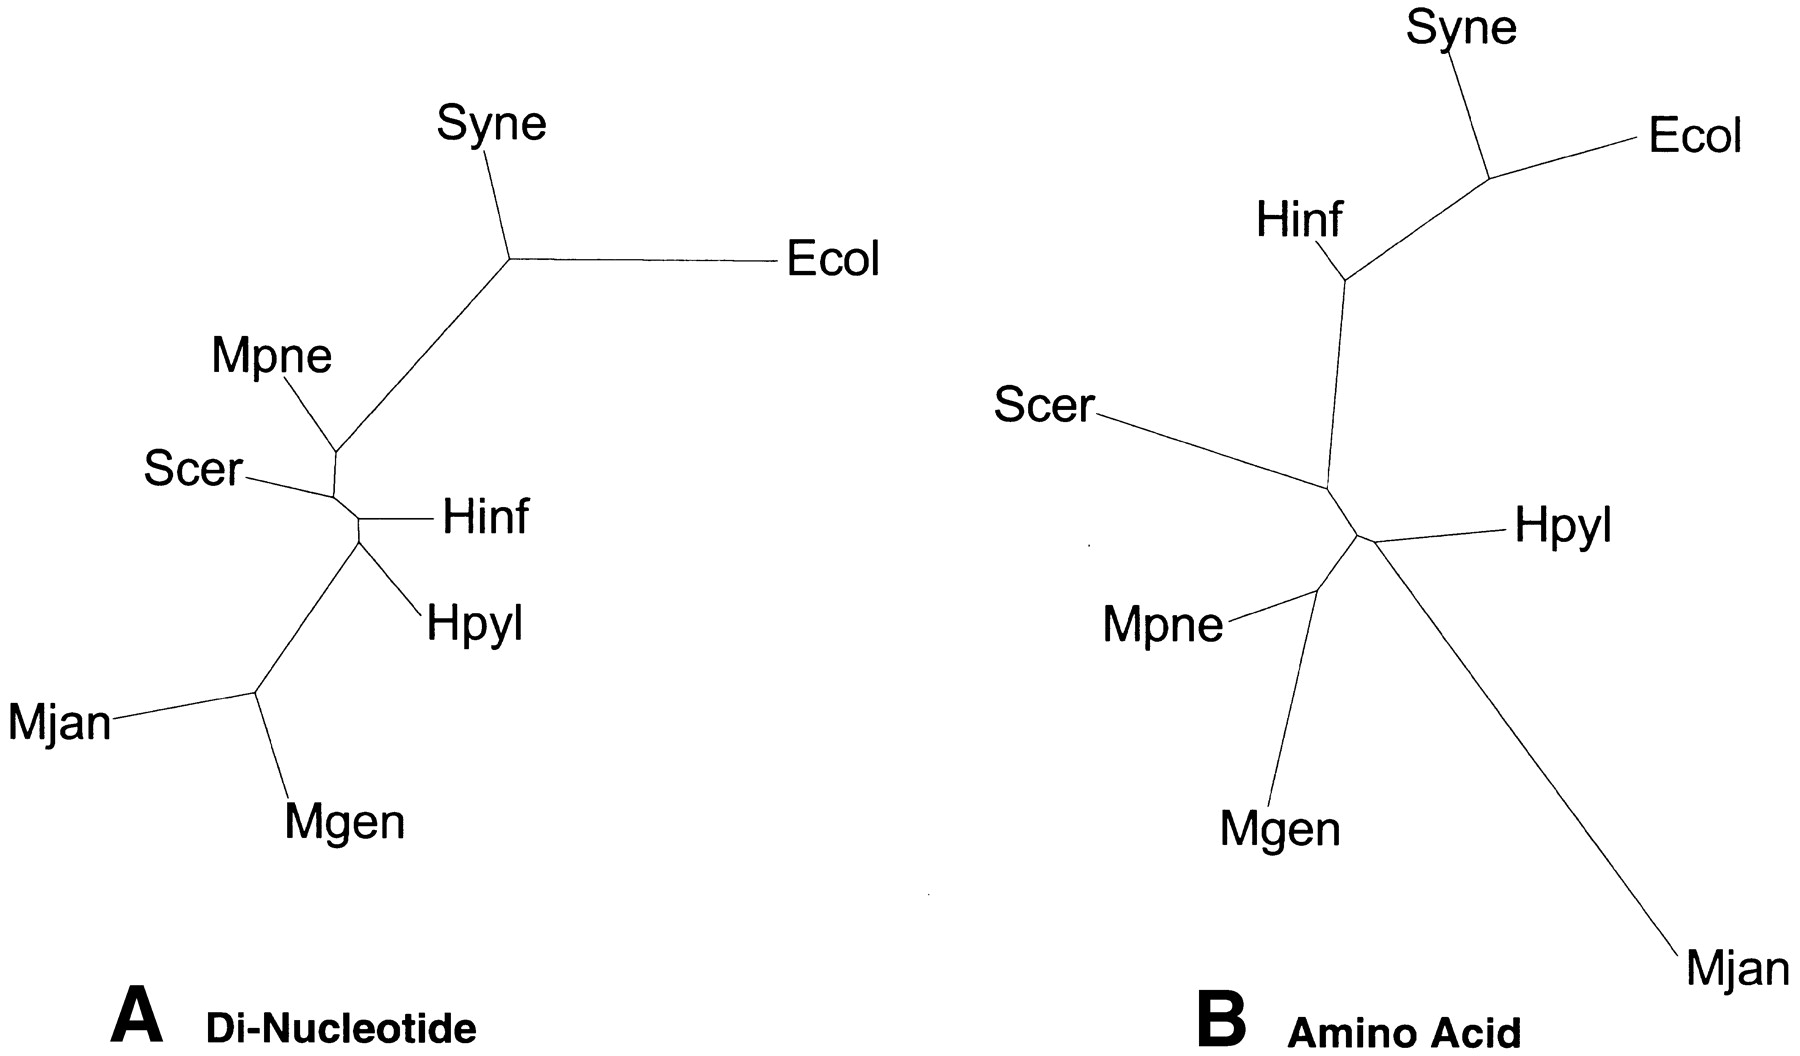
Trees based on overall composition. (A) Dinucleotide composition tree. We counted the relative frequency of the dinucleotides for the complete genomes of the eight organisms. Distance between two species of dinucleotides is the distance between the 16-dimensional vectors, with each axis representing a dinucleotide pair. PAUP then generated trees using the distance matrix. Figure 4A shows the resulting dinucleotide composition tree, which has almost no resemblance to the traditional ribosomal tree in Figure 1A. Even theM. genitalium and M. pneumoniae clustering, which is conserved throughout the survey, does not appear. This suggests that the dinucleotide method is not very accurate in the production of phylogenetic trees. Although it encompasses entire genomes, it reduces them to a 16-dimensional vector, losing much information. (B) Amino acid composition tree. This shows the tree generated from amino acid composition. Again, the relative frequencies of the amino acids were counted and a similar distance measure as in A was used. The distances between the genomes are calculated using 20-dimensional vectors, one for each amino acid. The resulting distance matrices were used to generate trees using PAUP. Interestingly, although this tree is still significantly different from the traditional tree in Figure 1A, it indeed is a great improvement upon the dinucleotide composition tree. Relatively, the organisms are closer in position to the traditional tree.


