
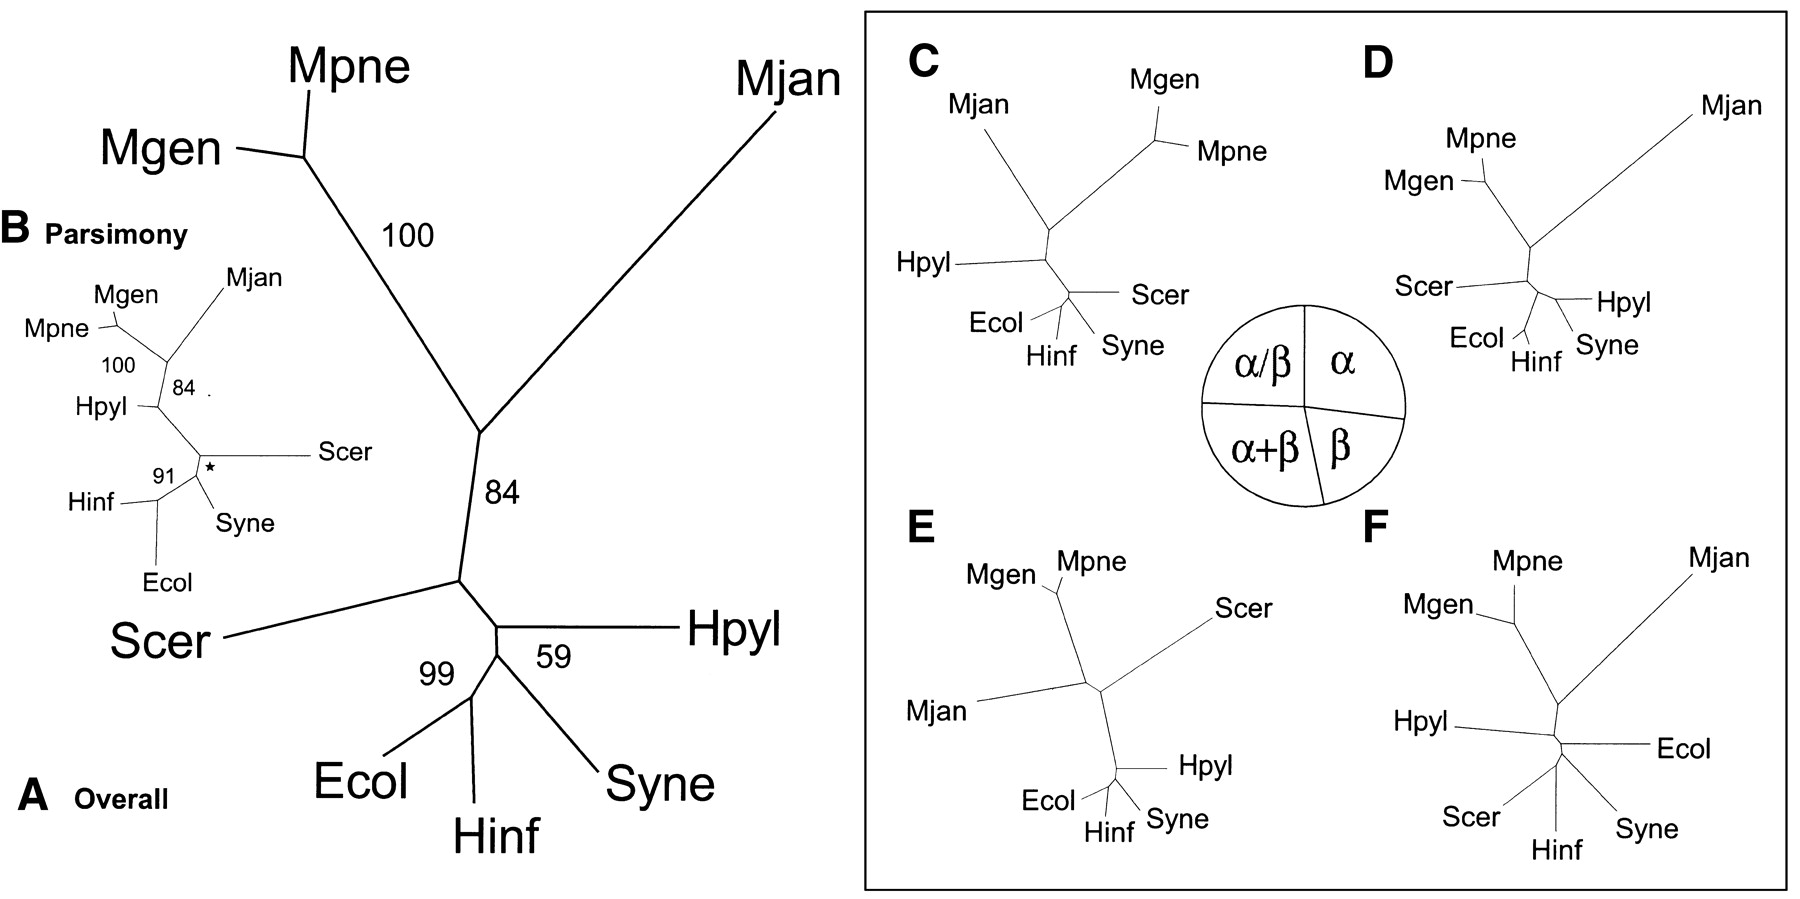
Genomic trees based on the occurrence of folds. (A) Genomic tree based on the overall occurrence of folds in the genomes, generated by a distance-based method. For each of the microbial organisms the presence or absence of folds was marked with 1 or 0, respectively. The folds that were not present in any of the genomes were excluded, because this does not provide any distinguishing information. Similar to the ortholog occurrence, a distance matrix was generated with the Hamming distance. (B) Genomic tree based on the overall occurrence of folds in the genomes, generated by parsimony. Instead of generating a distance matrix, parsimony can be used for tree construction. For this task, PAUP was used and the resulting tree is mostly similar to the distance-based tree. However, the locations ofS. cerevisiae and H. pylori are switched. Also, in contrast to the traditional ribosomal tree, S. cerevisiae is placed closer to M. jannaschii, whereas H. pylori is placed with the other bacteria. Therefore, the distance-based method as described in A seems to be better. For all the trees presented here, both distance-based and parsimony trees were generated; in general, as observed in this instance, the distance-based tree is closer to the ribosomal tree. The star shown in the bootstrap value represents a node where the bootstrap consensus tree results in a star decomposition and cannot be resolved. (C, D, E, and F) Distance-based genomic trees based on occurrence of folds in particular fold classes. In this analysis, instead of dividing the COGs into functional classes, the folds are fractionated into classes: all-alpha, all-beta, alpha+beta, and alpha/beta. As seen in the pie chart, the distribution of folds among the different classes is rather equal; each has approximately one quarter of the total. Of the four divisions of folds, the alpha+beta group is most similar to the overall tree, having the exact same topology. It also has the largest number of folds (81, 29% of the total). The all-alpha fold group has 27% (75) of the total folds and has almost the exact topology of the overall tree, except that H. pylori and Synechocystis are grouped together instead of just being close to each other. The alpha/beta group has 24% (68) of the total folds and is also very similar to the overall fold tree. The most surprising tree is that of the all-beta group. This is based on the smallest number of folds, which is 20% (55) of the total folds.


