
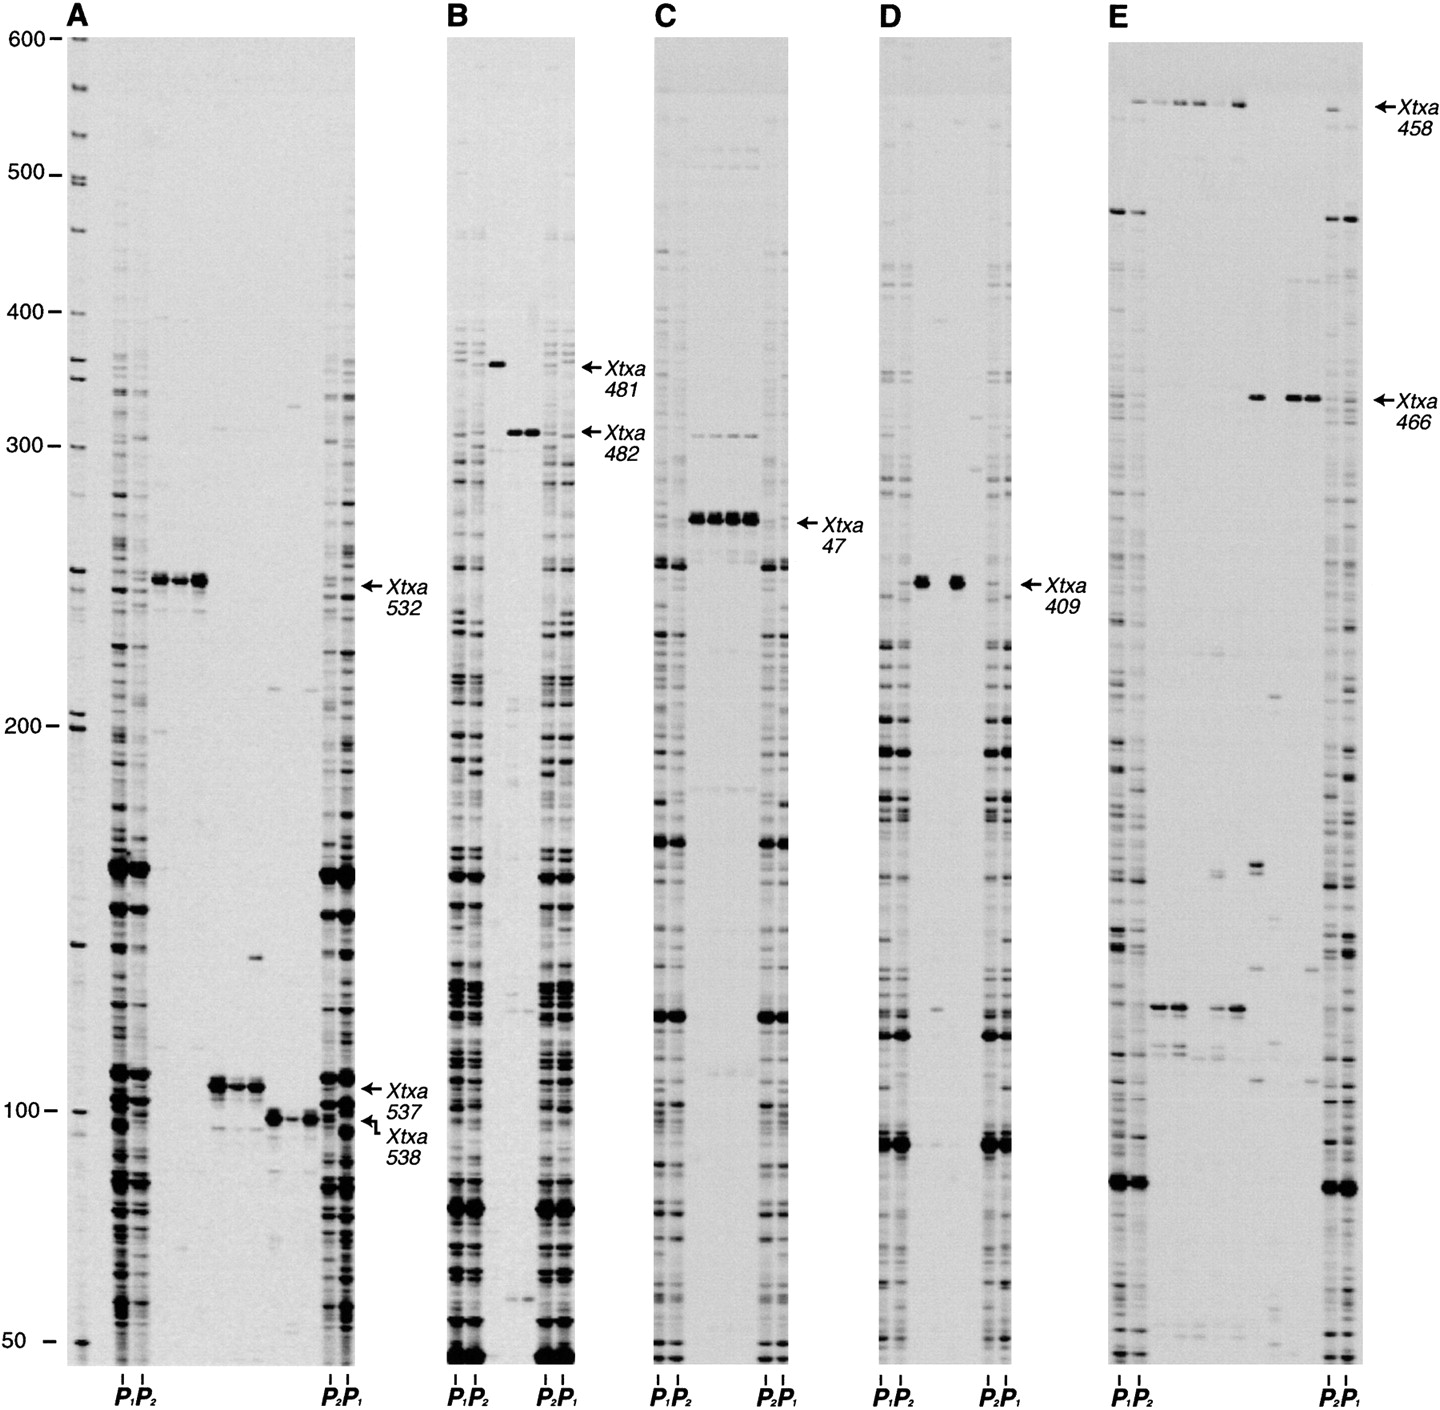
Analysis of individual BAC clones for SAS-DNA/AFLP markers. BAC clones identified as positive for SAS-DNA/AFLP markers following analysis of the BAC DNA pools were individually tested for the presence of the marker. AFLP templates were prepared from individual BAC clones as well as from genomic DNA (IS3620C, lanes marked P1 ; BTx623, lanes marked P2 ). AFLP templates were selectively amplified with fluorescent-labeled EcoRI + TGA/MseI + CGG (A); EcoRI + TGA/MseI + CTG (B); EcoRI + CAA/MseI + CAA (C); EcoRI + CAA/MseI + CCT (D); and EcoRI + CAA/MseI + CGT (E). Fluorescent-labeled products were run on a LI-COR DNA sequencer. Numbers to the left of panel Aindicate the sizes (bp) of molecular weight standards. SAS-DNA/AFLP markers identified in the individual BAC clones and BTx623 genomic DNA are indicated to the right of each panel.


