
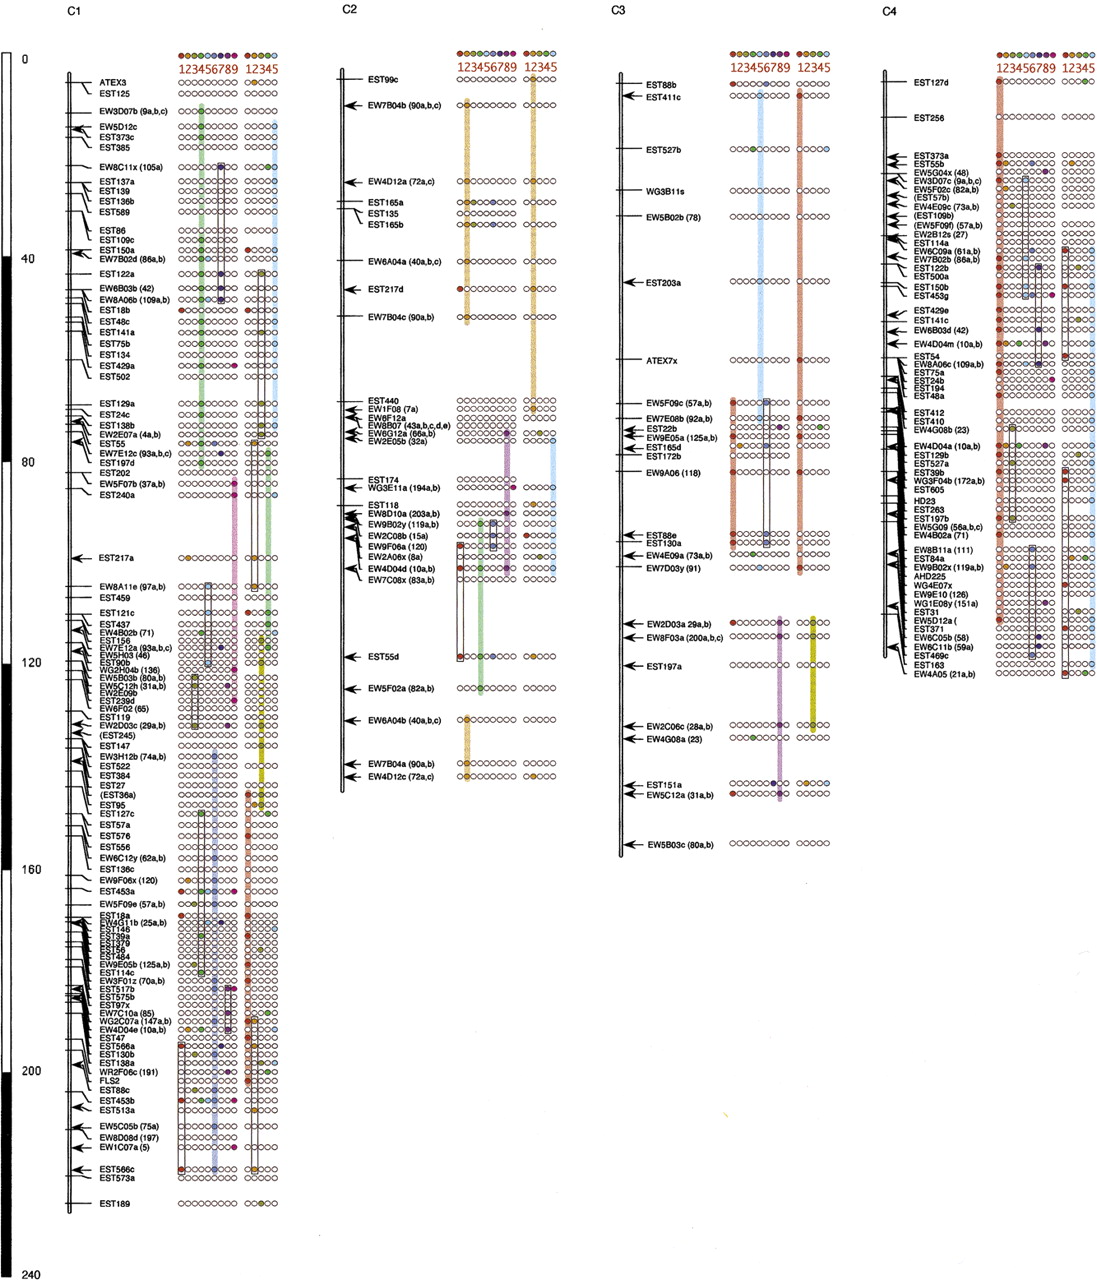
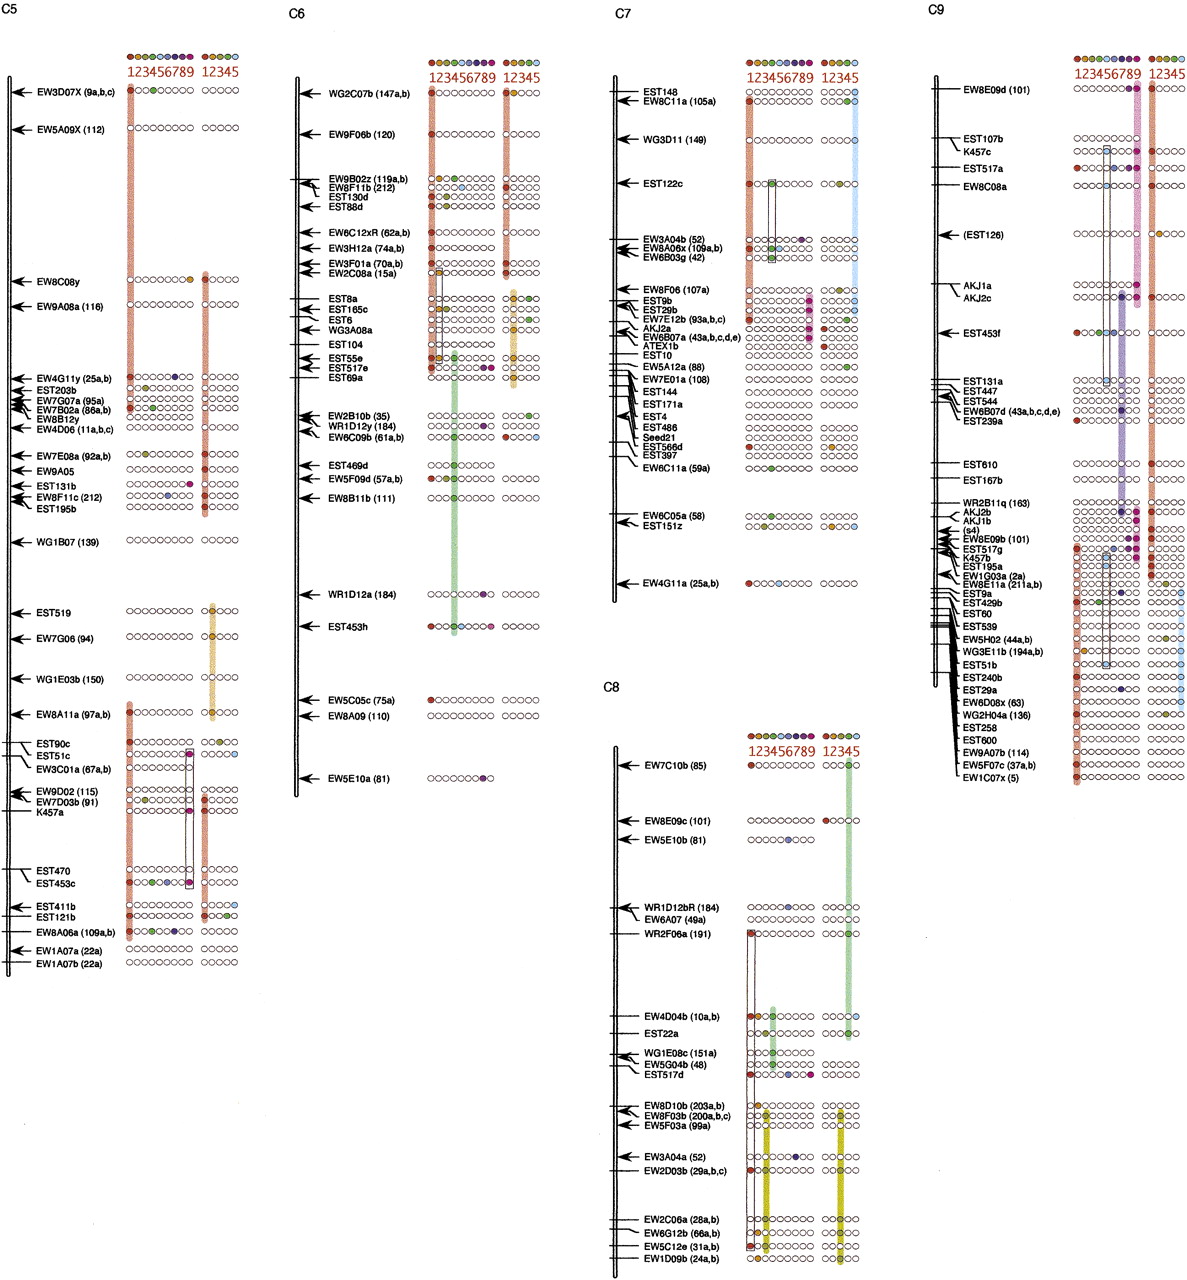
Composite RFLP linkage map of Brassica olearacea RCB x GC, RCB x CAN, RCB x PK and RCB x BK F2 Populations. Filled circles next to the loci indicate homoeologous Brassica loci (chromosomes 1-9, near right) or homologous Arabidopsis loci (chromosomes 1-5, far right) detected by the same probe. Open circles indicate that no polymorphism was detected for homoeologous (Brassica) and homologous (Arabidopsis) loci. A letter “R” next to the probe name indicates that the probe hybridizes to a repetitive DNA sequence in Arabidopsis. Specific colors are assigned to each homoeologous and homologous chromosome. Markers included in the duplication (Brassica) or one-to-one (Arabidopsis) models are connected by colored columns. Open columns indicate possible triplicated (Brassica) or duplicated (Arabidopsis) regions.


