
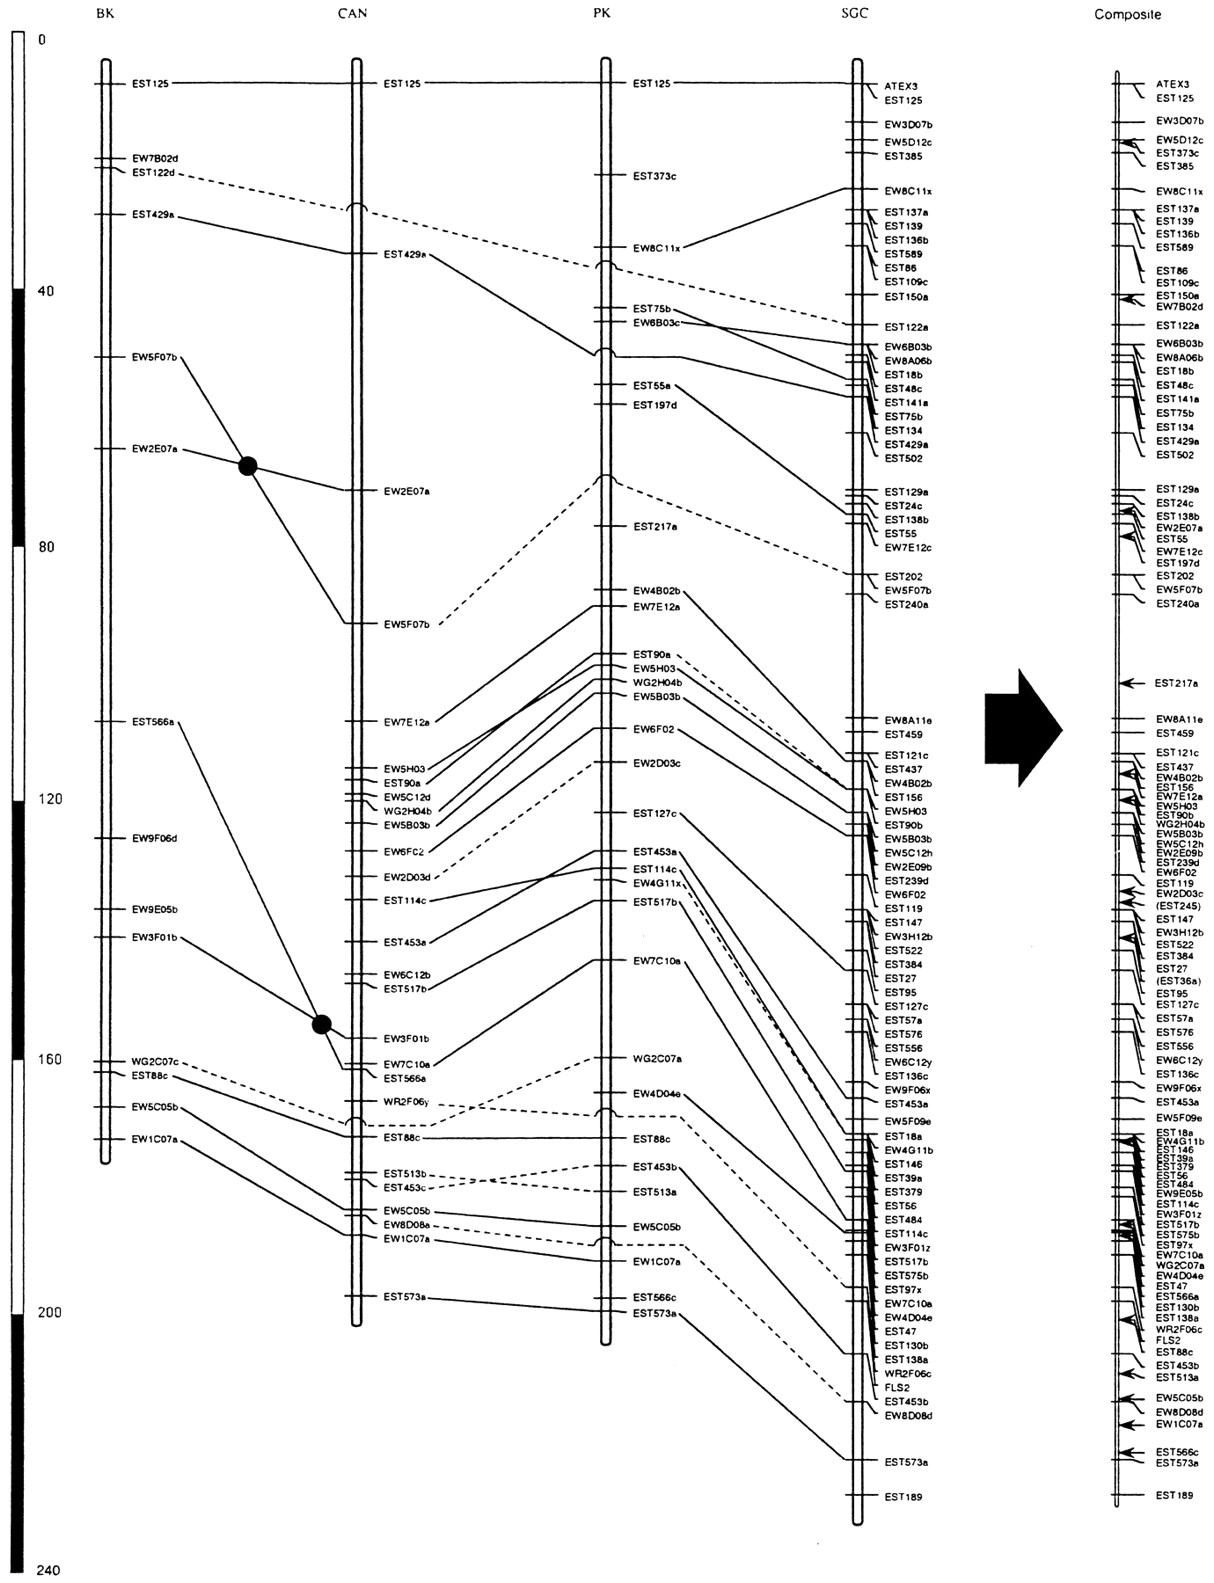
Figure 1.
The assembly of the Brassica chromosome 1 composite map. Common loci (based on common restriction fragment sizes) were connected by solid lines, putatively homologous loci (with different restriction fragment sizes, but at corresponding sites) are connected by dashed lines. Filled circles placed on crossed lines indicate that respective orders of loci are statistically significantly different (≥LOD 2.0) in the respective maps, suggesting possible chromosomal rearrangements. Arrows indicate the inferred locations of unique loci in the consensus map.


