
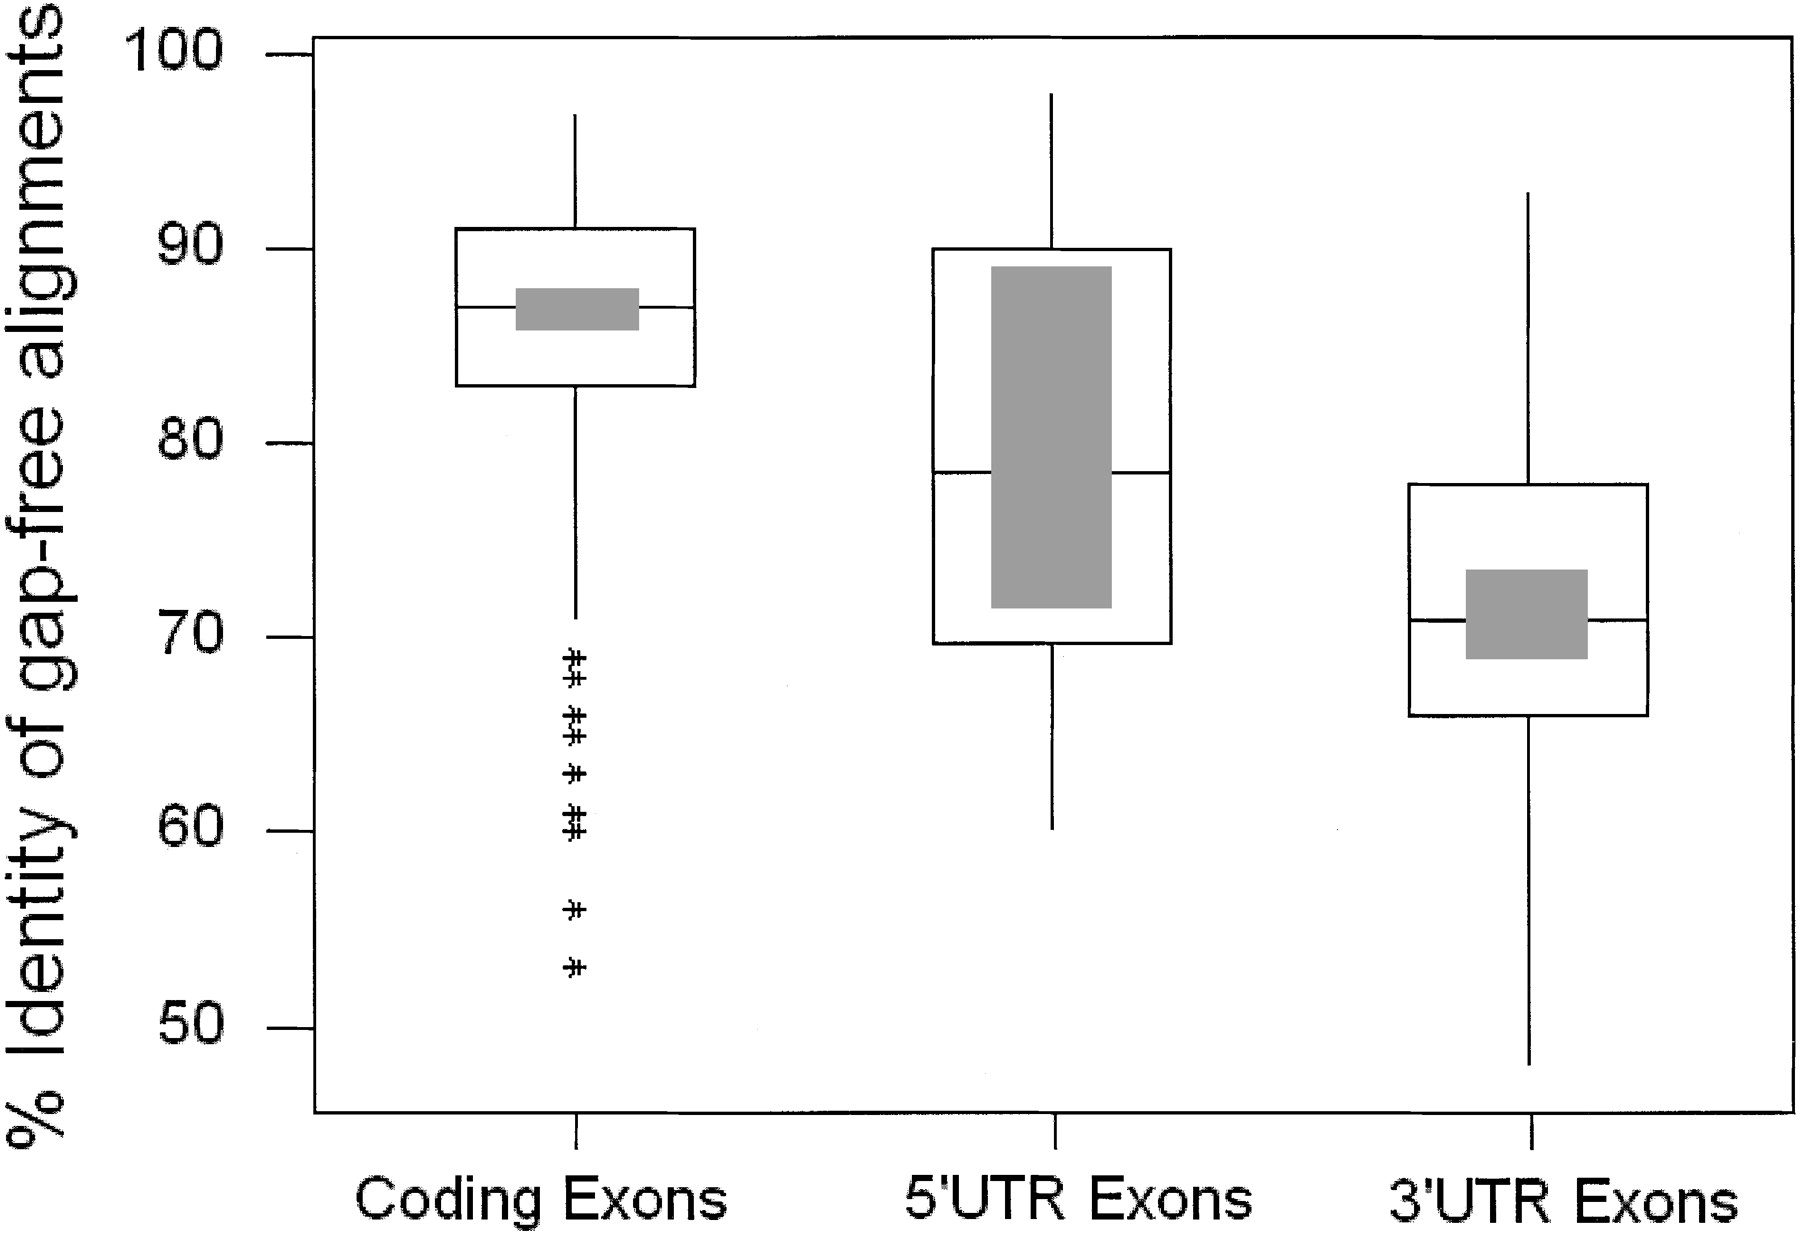
Figure 4.
Distribution of percent identities of ECRs in coding and noncoding regions of mouse and human genomes. A box-plot showing the distribution of percentage identity in gap-free alignments identified from three categories: 5′ UTRs, coding exons (CDS), and 3′ UTRs. The interquartile range is depicted as the open box with the median being shown as the line in the middle of this box. The shaded box indicates the 95% confidence interval. Outliers are shown as stars.


