

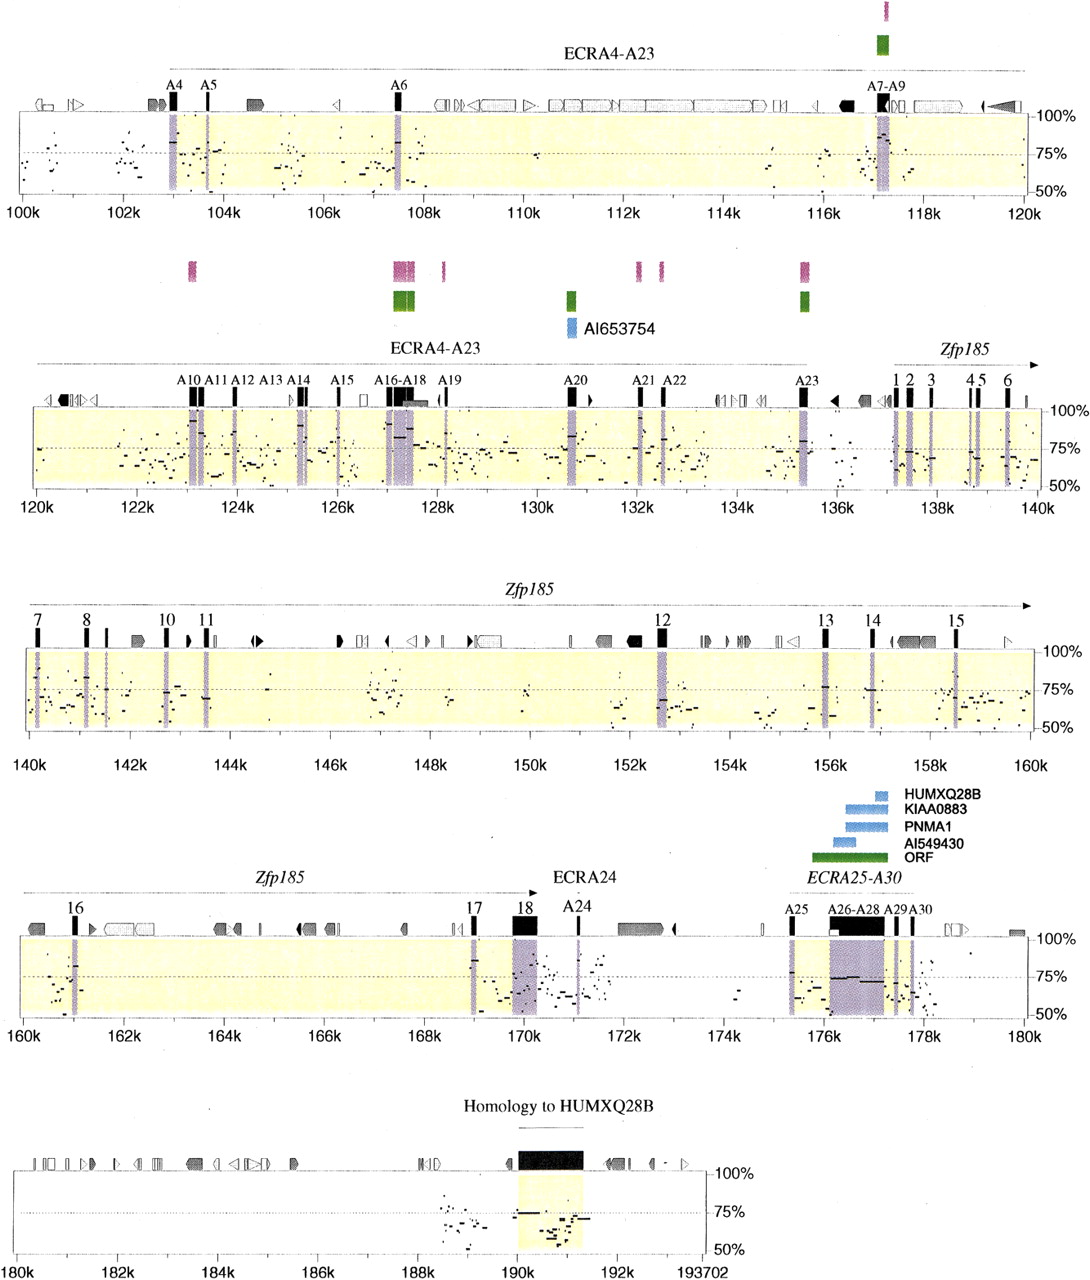


(See pages 761–764.) PIP plot of mouse contig A (A) and mouse contig B (B). A PIP plot showing the mouse genomic sequence on the x-axis, and the percentage sequence identity (50%–100%) on the y-axis. Annotation is illustrated on the top of each main plot, with confirmed and putative exons depicted as numbered black boxes. The other icons along the top of the box depict repeats (grey pointed boxes are L1 repeats, light grey triangles are SINEs other than MIR, black triangles are MIRs, black pointed boxes are LINE2s, dark grey triangles are LTR elements, and dark grey pointed boxes are other kinds of interspersed repeats, such as DNA transposons, short dark grey boxes are CpG islands where the ratio CpG/GpC exceeds 0.75, short white boxes are CpG islands where the ratio CpG/GpC lies between 0.6 and 0.75). Specific annotation for each of the putative genes is illustrated above the computer-generated annotation, with gene predicitions shown as purple boxes, ORFs as green boxes, and sequence similarity as blue boxes.


