
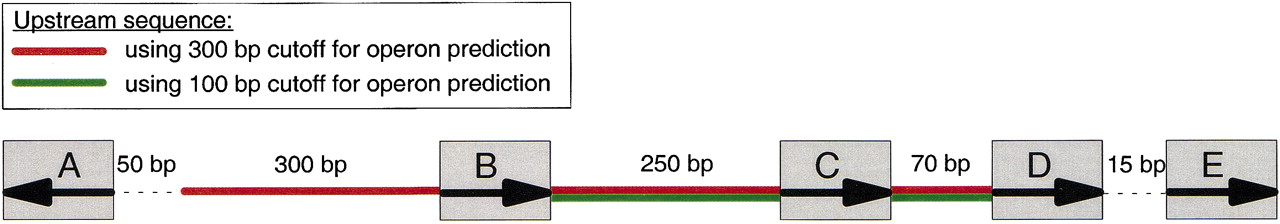
Example of upstream region prediction. This shows the predicted upstream region for gene E taking up to 300-bp of sequence upstream of the predicted operon head, and using two different cutoffs for operon prediction (300 and 100 bp). First the algorithm checks the length of the upstream region for the gene in question. If an intergenic region is shorter than the distance cutoff, then the entire intergenic region is stored for motif finding and the next intergenic region further upstream is considered as well. This continues until an intergenic region is encountered that is either divergently transcribed, or longer than the distance cutoff.


