
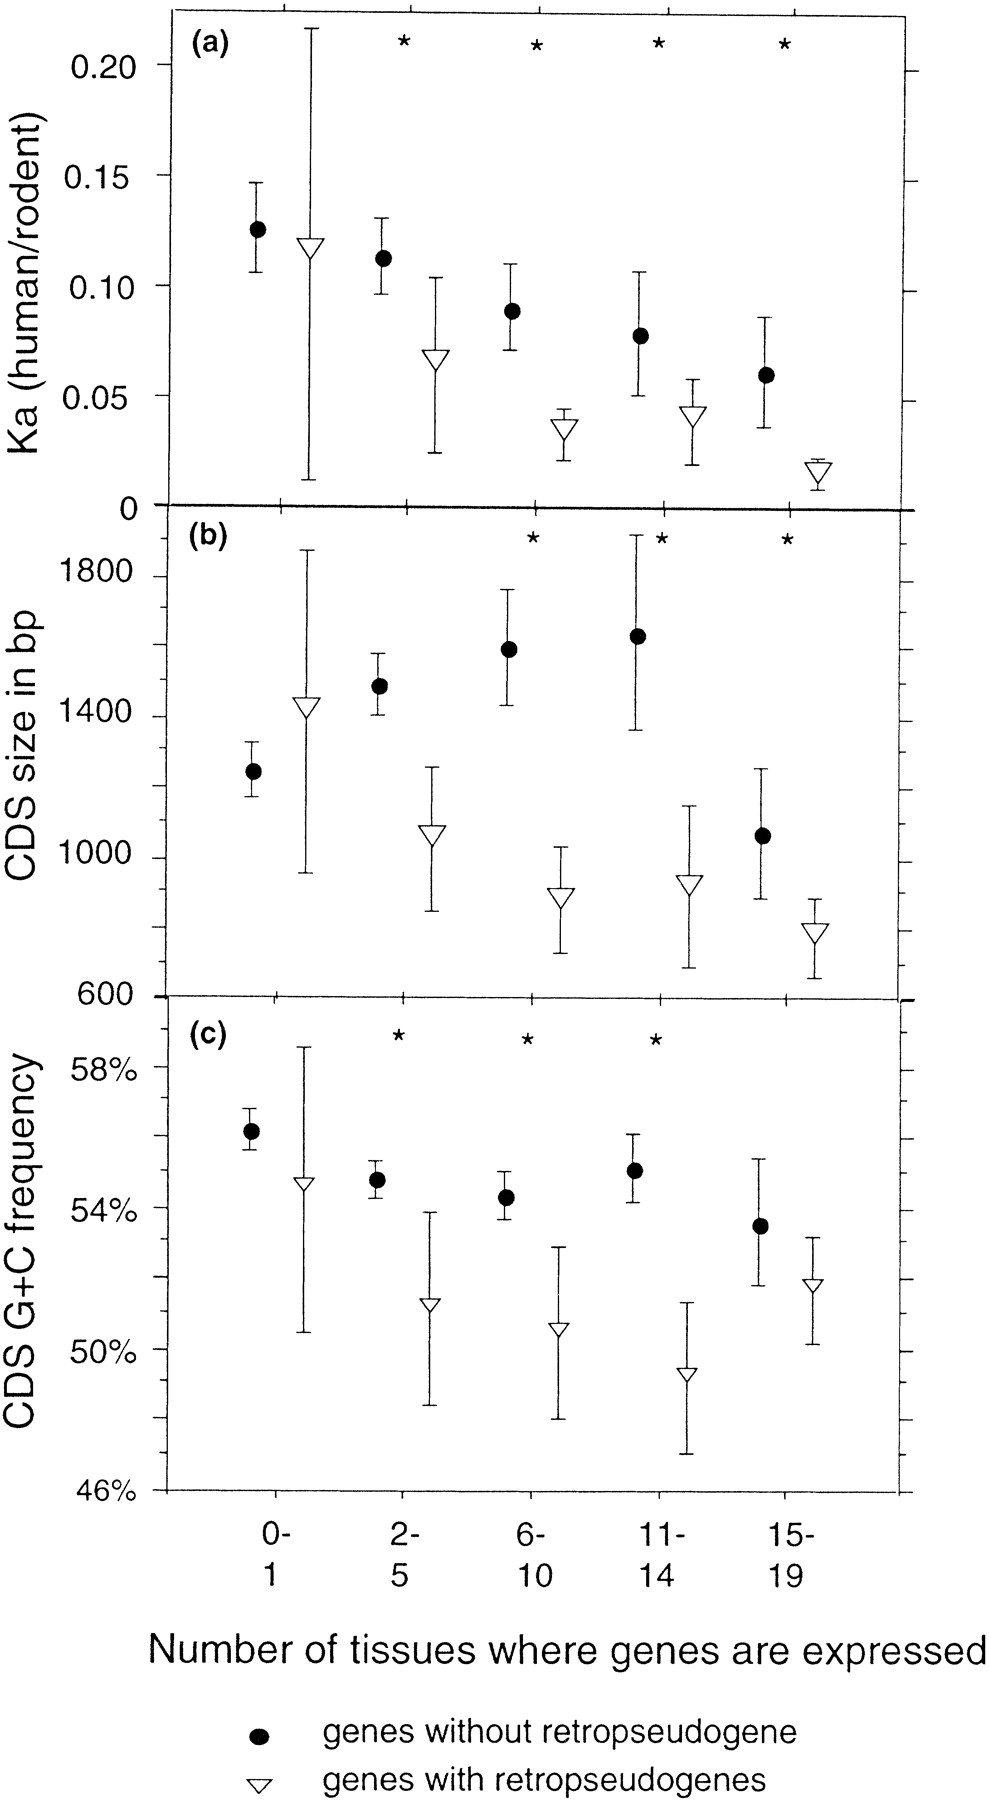
Figure 3.
Relationships between gene expression pattern and the nonsynonymous substitution rate (Ka; a), the size (b), and the GC content (c) of CDSs for genes with and without retropseudogenes. Error bars, 95% confidence interval. (Stars) Expression classes for which the difference between genes with and without retropseudogenes is significant (Wilcoxon test:P < 0.05).


