
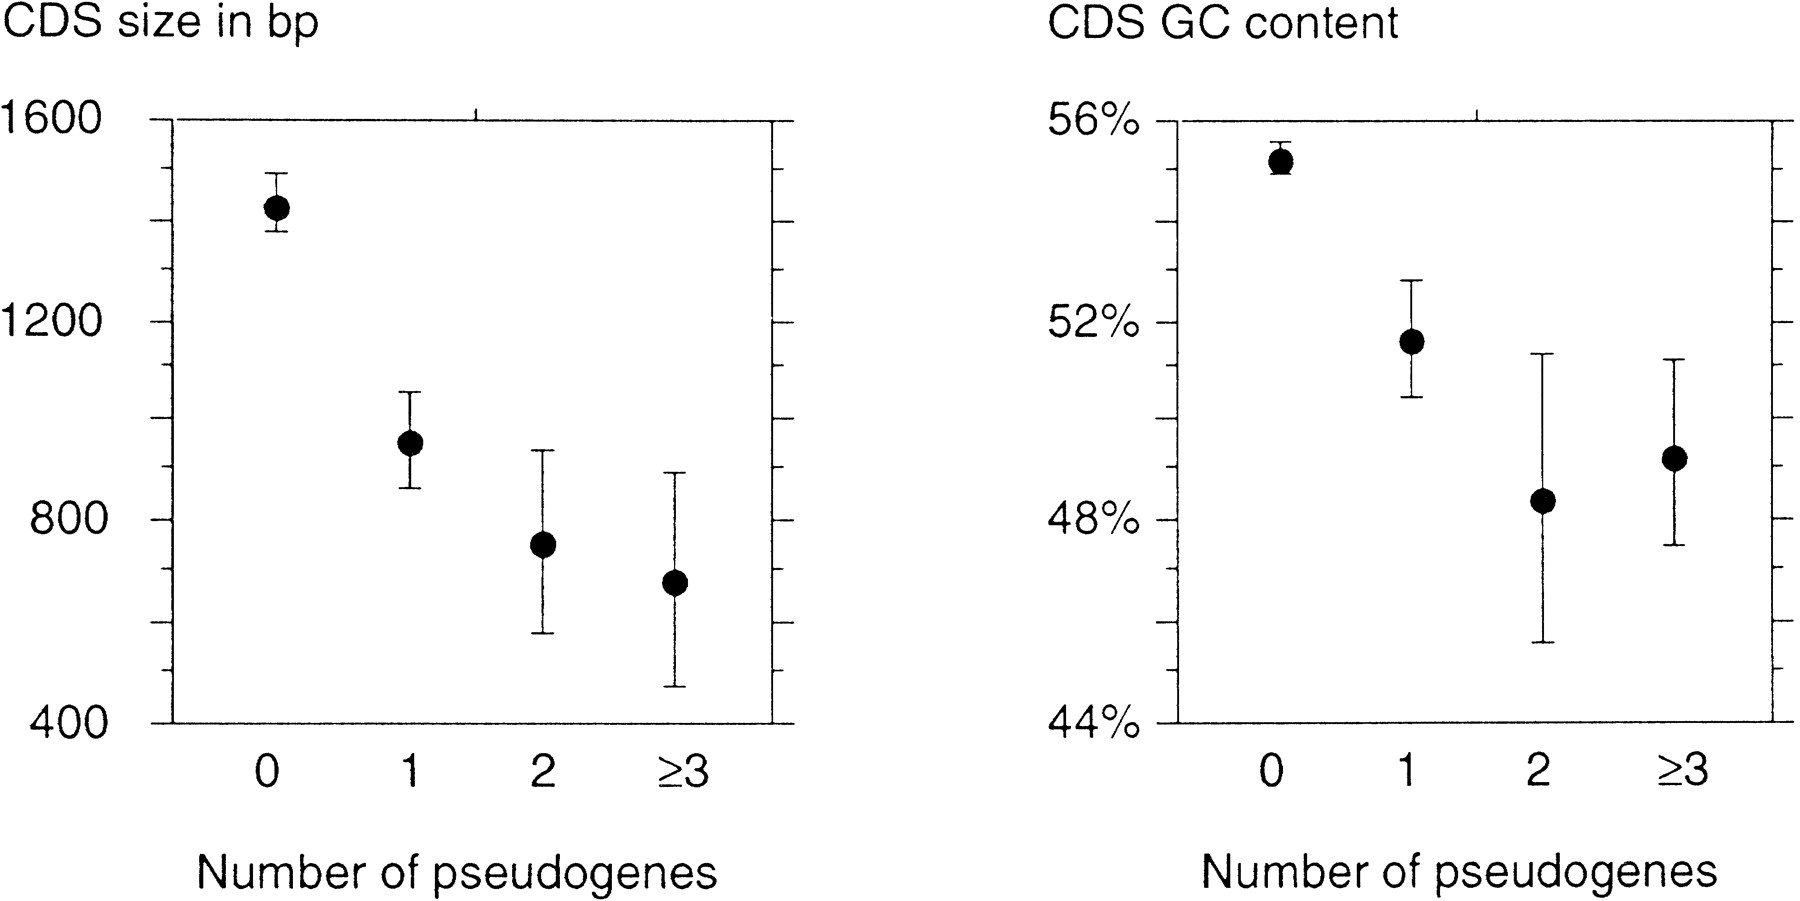
Figure 2.
Average CDS length and average CDS GC content of genes according to their number of retropseudogenes. Error bars, 95% confidence interval.
(Downloading may take up to 30 seconds. If the slide opens in your browser, select File -> Save As to save it.)
Click on image to view larger version.
Average CDS length and average CDS GC content of genes according to their number of retropseudogenes. Error bars, 95% confidence interval.
 CiteULike
 Delicious
 Digg
Digg Facebook
 Google+
 Reddit
 Twitter
