
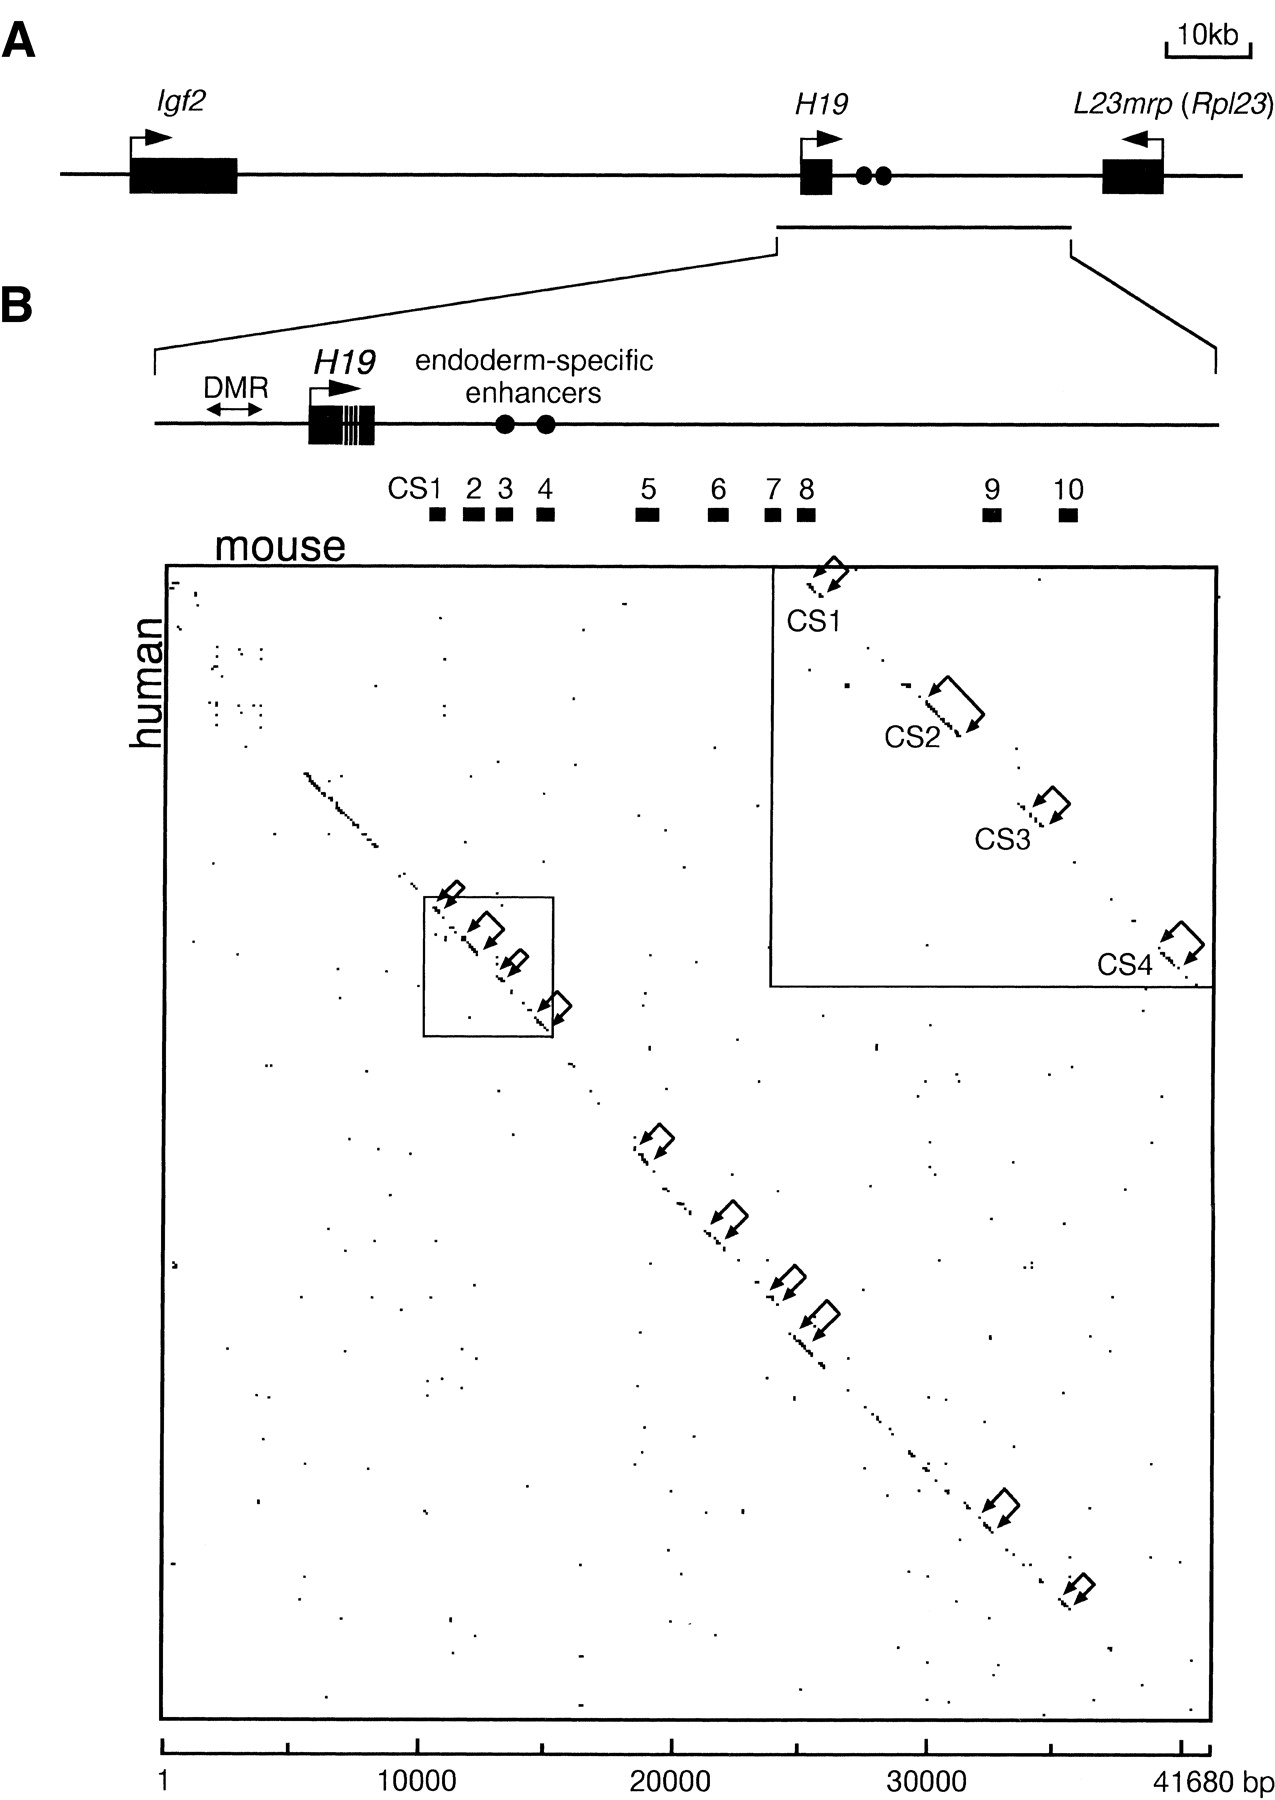
Comparison of the human and mouse H19 region sequences. (A) Map of the Igf2/H19 region. The region analyzed is indicated by a horizontal line below the map. (B) Dot matrix alignment. (Top) Lower magnification of theH19 region. The homology plot program DNASIS v3.0 (Hitachi Software Engineering) was used to align the mouse (x axis) and human (y axis) H19 sequences with a criterion of 22 matching bases in a window of 30. Brackets with arrows in the matrix and bars between the map and matrix indicate conserved segments (CS1–CS10). (Inset) Higher magnification of the CS1–CS4 region. The GenBank sequences used are as follows: mouse, AF049091(bases 1–41680); human, AF087017 (bases 1–40558) and AC004556 (bases 82896–88682).


