


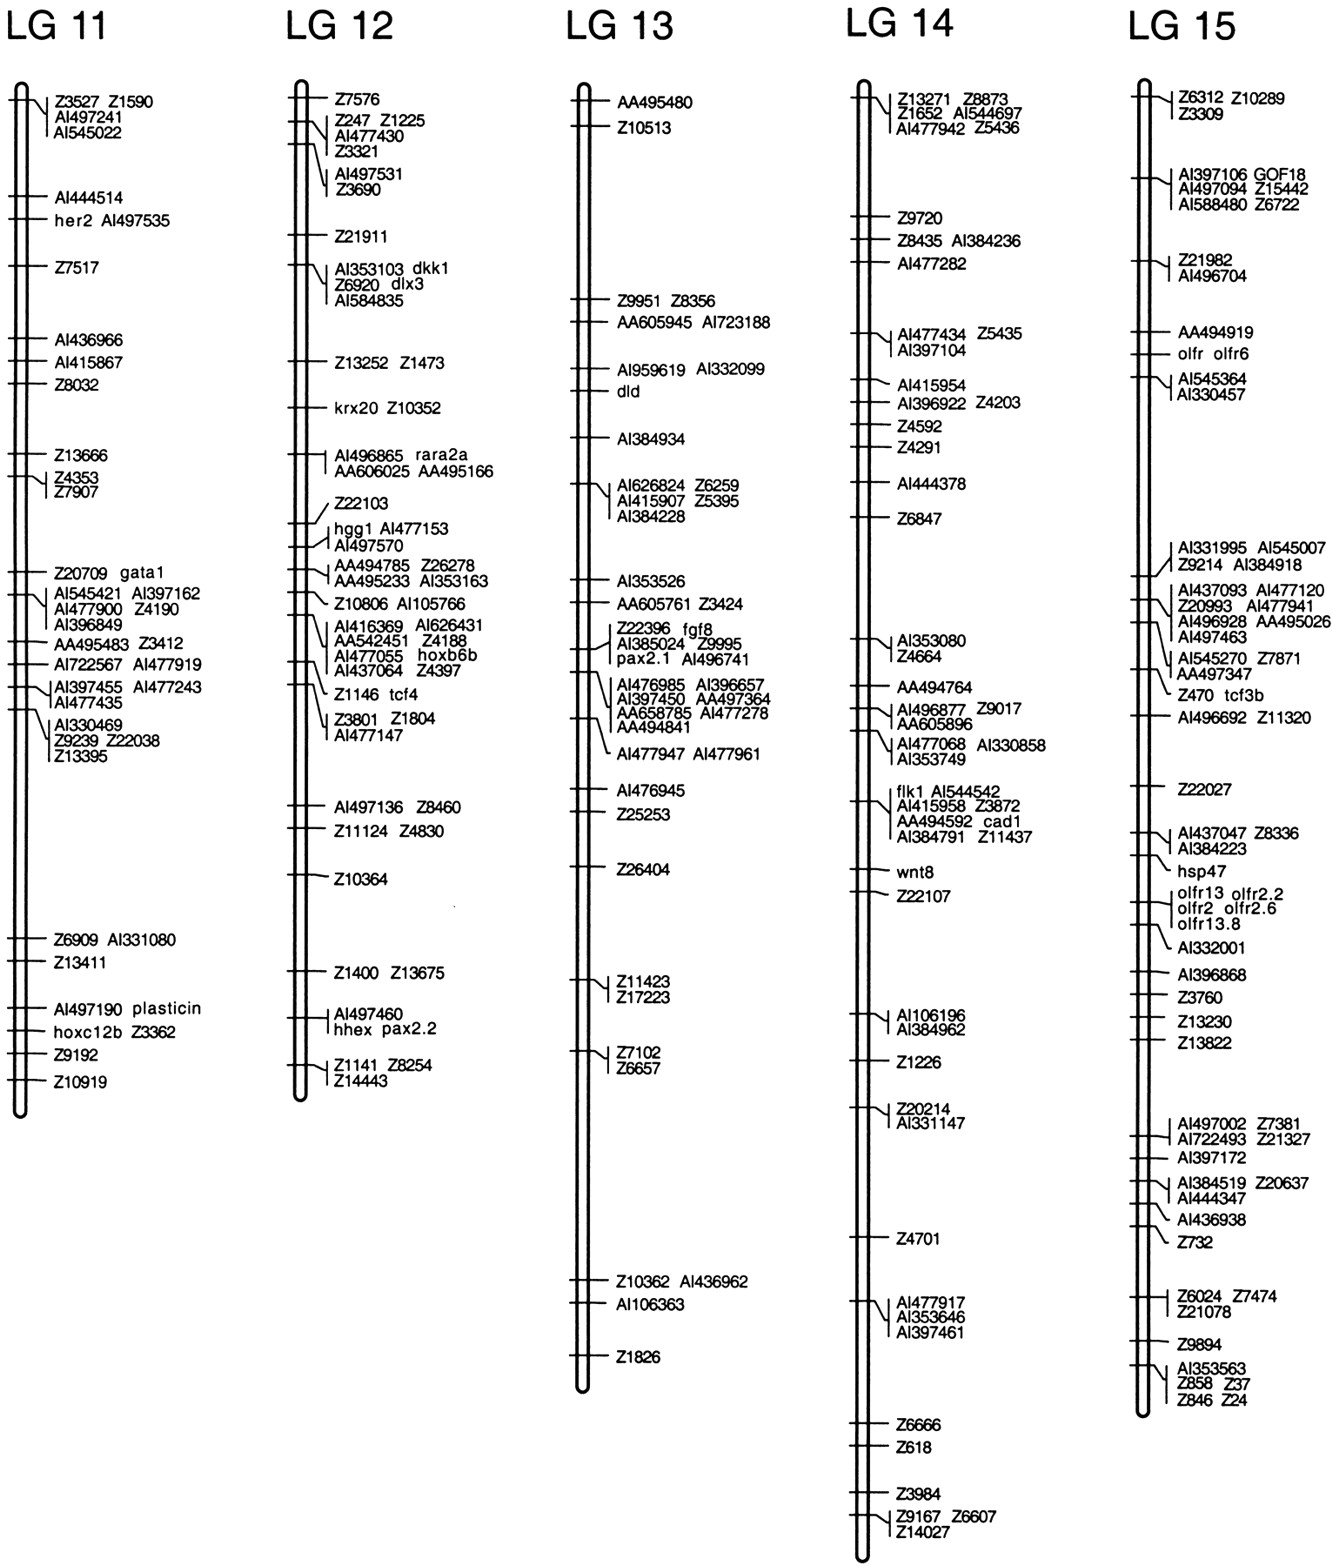
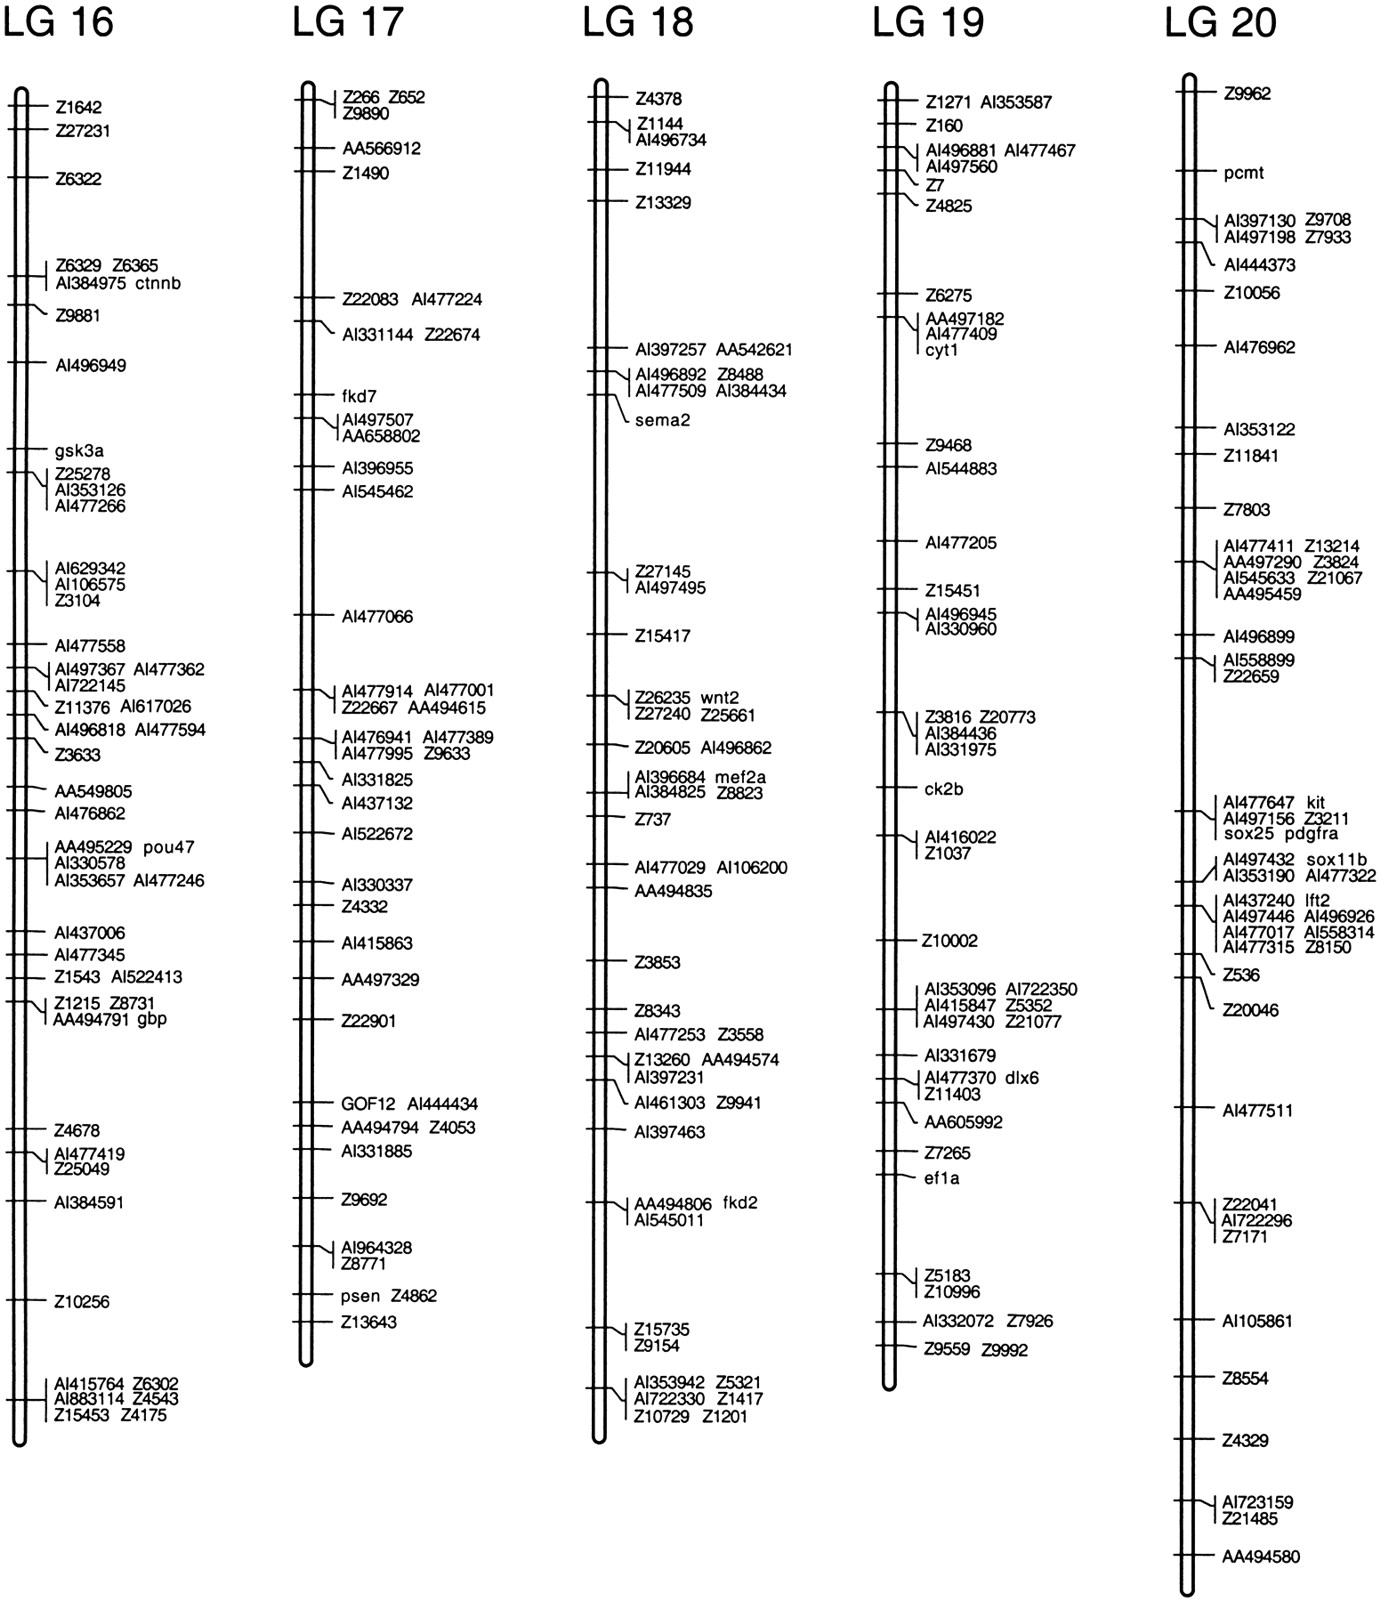

Figure 3.
(See pages 561–565.) Genetic linkage map of the zebrafish genome. Positions of 1364 polymorphic markers scored on the HS panel are shown. GenBank accession numbers, UniGene numbers, and primer sequences for genes and ESTs are shown in Table 1 (available online athttp://www.genome.org). SSLP markers were described by Shimoda et al. (1999).


