
Figure 2.
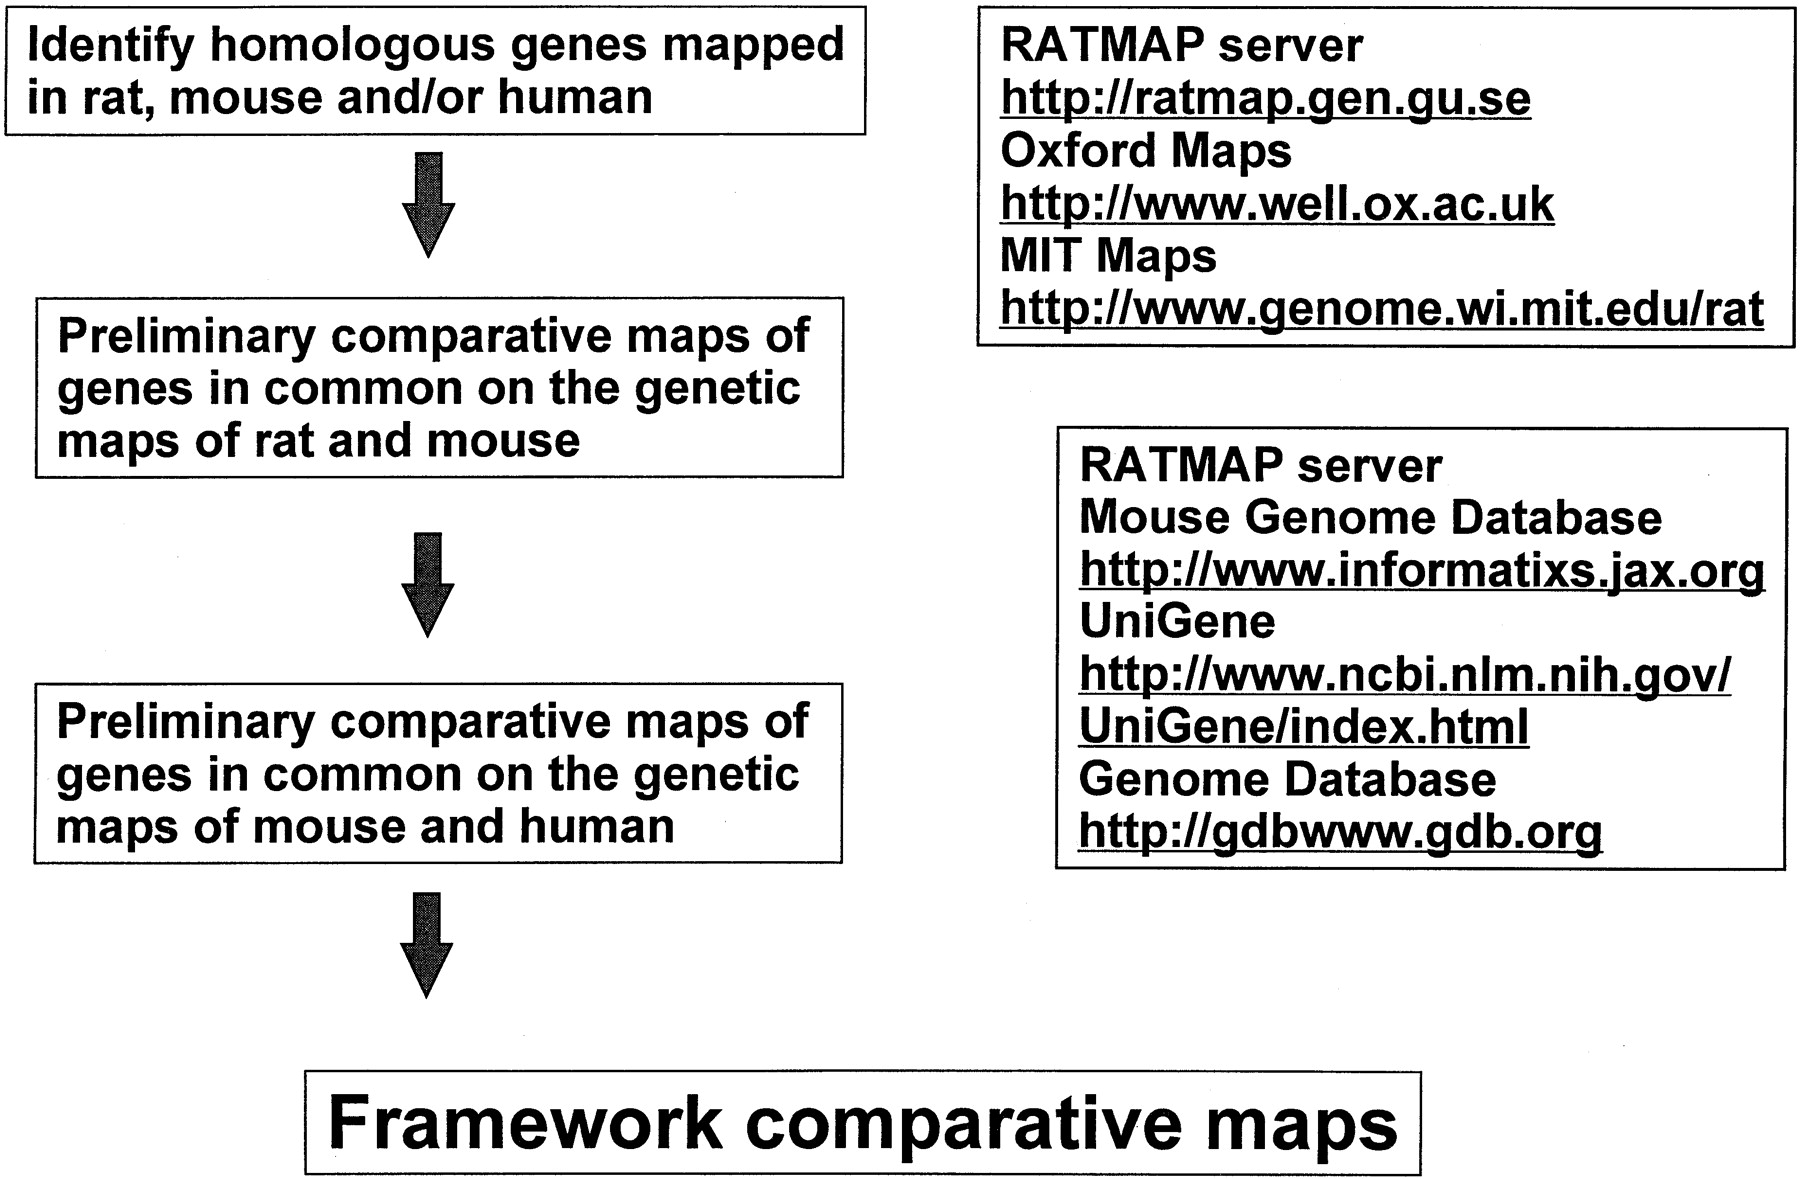
Flow chart showing the algorithm for constructing framework comparative maps between rat, mouse, and human genomes based on publicly available databases.
(Downloading may take up to 30 seconds. If the slide opens in your browser, select File -> Save As to save it.)
Click on image to view larger version.
Flow chart showing the algorithm for constructing framework comparative maps between rat, mouse, and human genomes based on publicly available databases.
 CiteULike
 Delicious
 Digg
Digg Facebook
 Google+
 Reddit
 Twitter
