
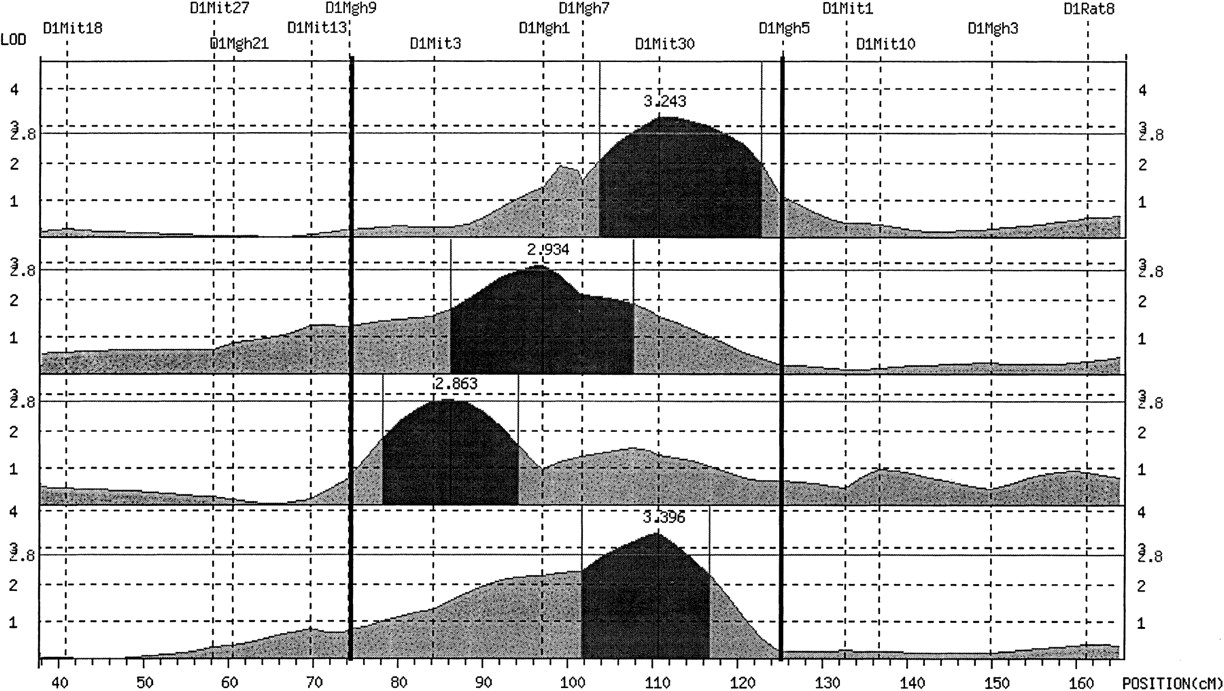
Figure 1.
Demonstration of QTL clustering. The dark-shaded area of the QTL profile represents the 99% C.I. of each QTL. The dark vertical lines indicate the boundary of the QTL cluster, which is defined by the nearest two markers flanking the combined 99% C.I, in this example D1Mgh9 and D1Mgh5.


