
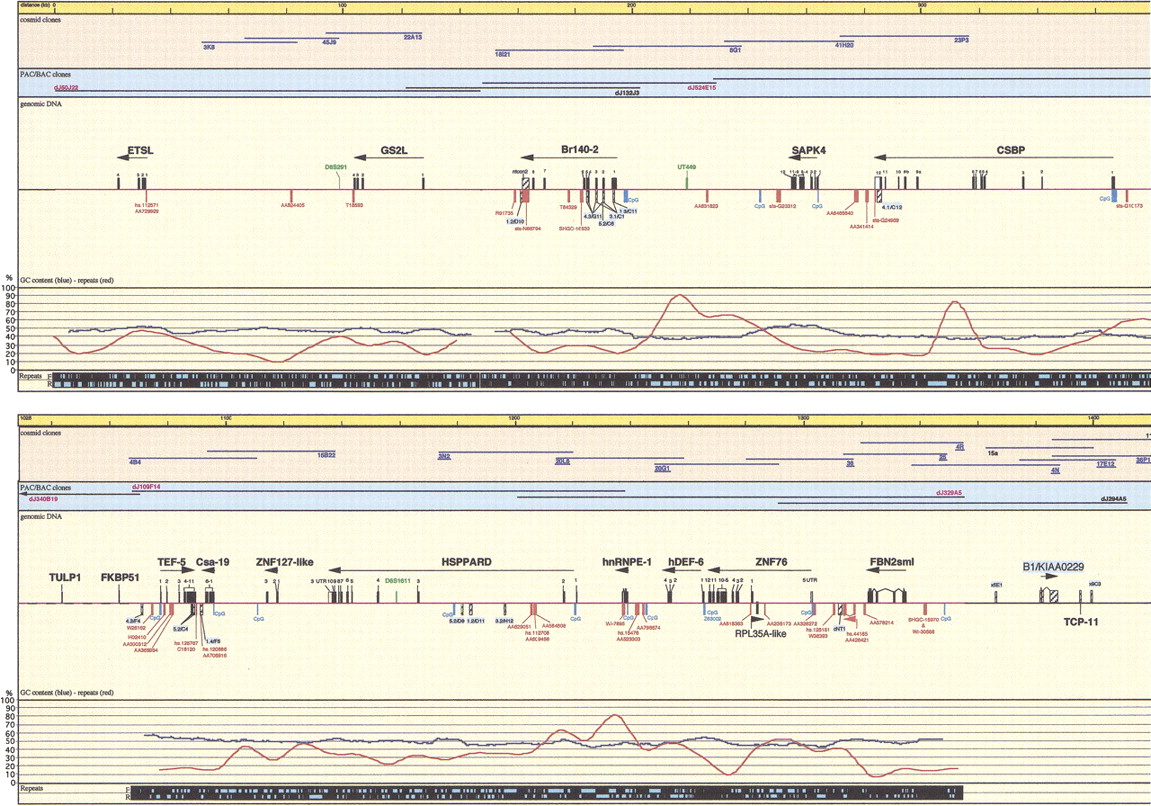
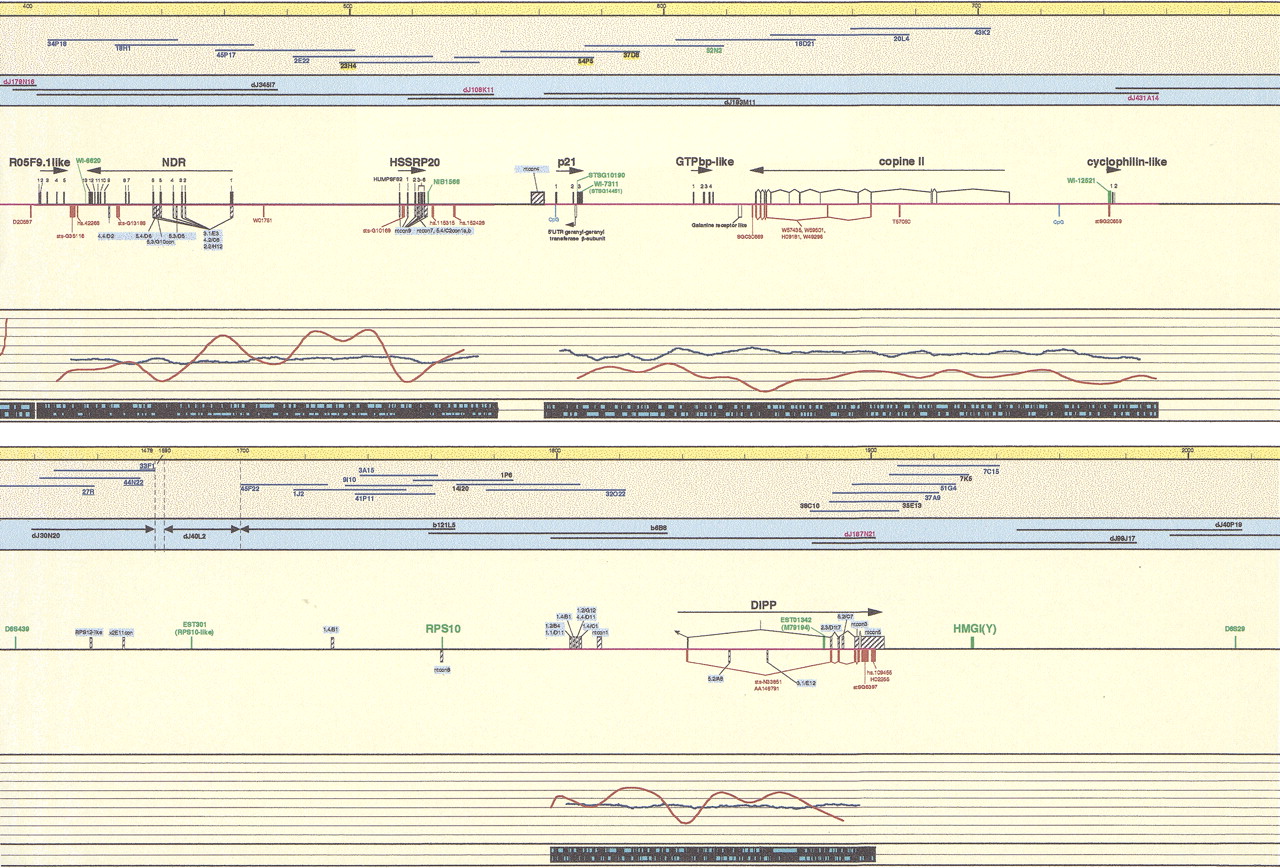

Schematic representation of the transcript map of the 6p21.2–6p21.3 boundary region, immediately centromeric of the MHC. All physical distances are indicated in the top bar as kilobases and thin lines represent 20-kb intervals. Only the relevant minimal number of clones is indicated. Blue cosmid names were used in cDNA selection, underlined in exon trapping, yellow highlighted in isolation of GC rich fragments. PAC/BAC clones are indicated with black lines (prefix dJ for PACs). Clones are drawn to scale. PAC dJ40L2 is extending on either side, as the arrows indicate. Sequenced clones are indicated in red. PAC dJ340B19 is only partially sequenced; therefore, the location of the identified transcripts is tentative. The genomic DNA shows sequenced parts (red lines). (Black boxes) Mapped and predicted exons; (red boxes) mapped ESTs and Unigene contigs; (light blue boxes) predicted CpG islands; (green boxes) genetic markers; (hatched boxes) selected cDNA clones, cDNA contigs, and exons (names with blue background); (open boxes) 3′ and 5′ untranslated regions (all drawn to scale). Linking lines were used to indicate multiple matches of EST and cDNA contigs on the genomic sequence and to denote linked exons, where this is not obvious. Numbers above black boxes indicate the relevant exon number. The names of genes are indicated above the exons; the arrows show the orientation of transcription. The percentage of GC (blue graph lines) and percentage of repeats (red graph lines) are indicated under the sequenced genomic DNA and in the last black stripe the exact position of repeats is indicated as turquoise boxes for the Forward and Reverse strand. Position 0 is the true centromeric end of PAC clone dJ50J22.


