
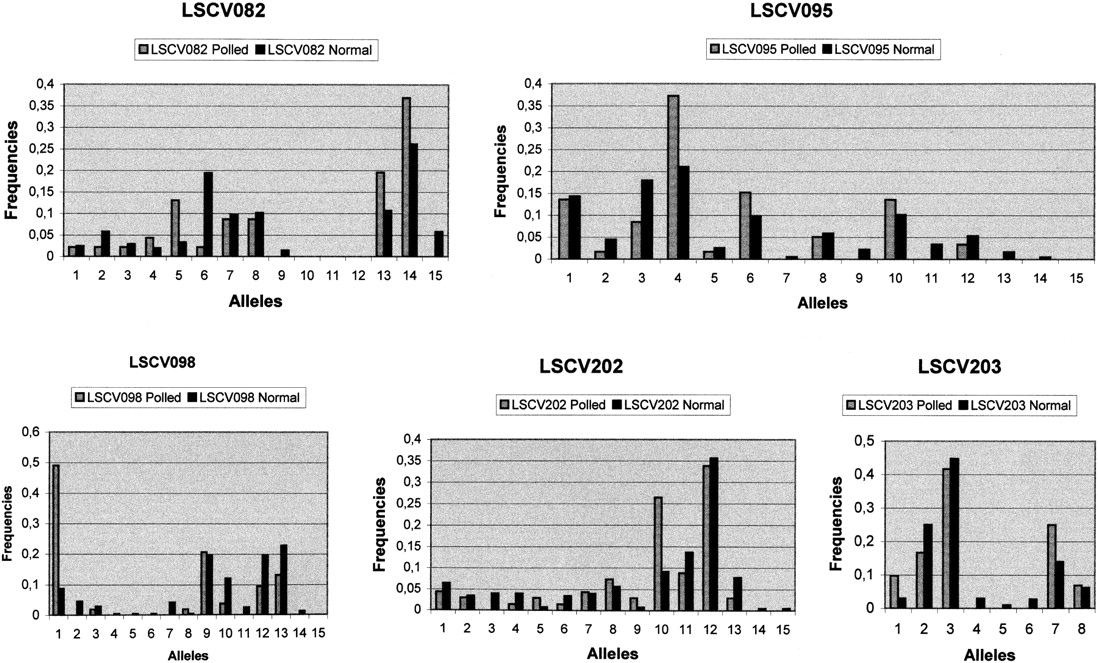
Figure 2.
Histograms of allele frequencies for polled and normal unrelated goats for microsatellites LSCV082, LSCV095, LSCV098, LSCV202, and LSCV203. Genotypes were determined by denaturing polyacrylamide/urea gel electrophoresis after incorporation of [α-33P]dATP in the PCR products. Alleles were numbered from 1 to n, with 1 corresponding to the largest allele size and counted for the 35 Pp (hornless) goats and the 211 pp (with horns) goats. Total counts were then divided by the total number of alleles for each category, to estimate allelic frequencies. Haplotypes were then deduced for P chromosomes by analyzing the progeny of Pp individuals (see Table 2).


