
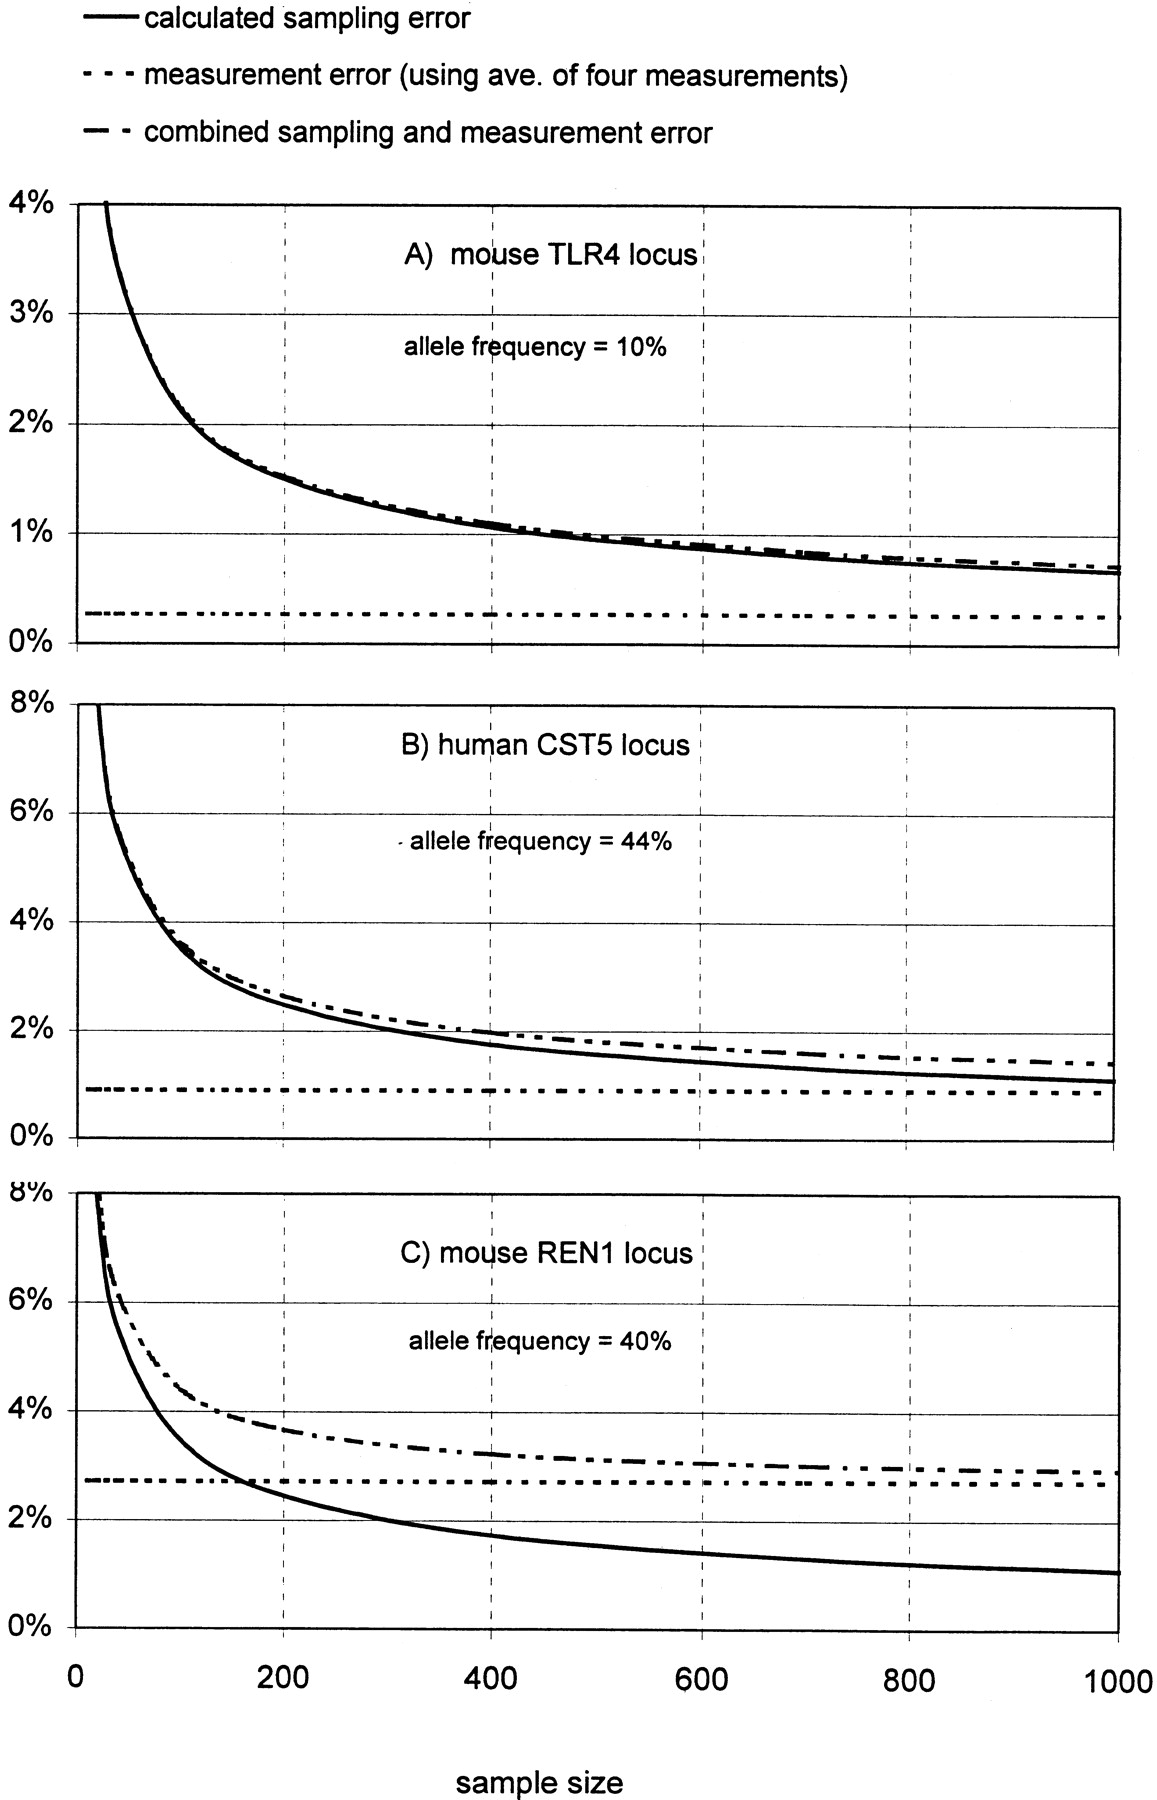
Figure 4.
The impact of measurement error for three SNP assays. (A) Plotted as the solid line is the expected sampling error for this SNP given an allele frequency of 10% (see text) for sample sizes up to 1000. The upper broken line is the estimated combined sampling and measurement error for this assay based on Table 3 and using the average of four measurements. This measurement error alone is the lower broken line. (B) The same as A for the human CST5 locus (Table 2). (C) The same as A and B for the mouse REN1 SNP (Table 3).


