
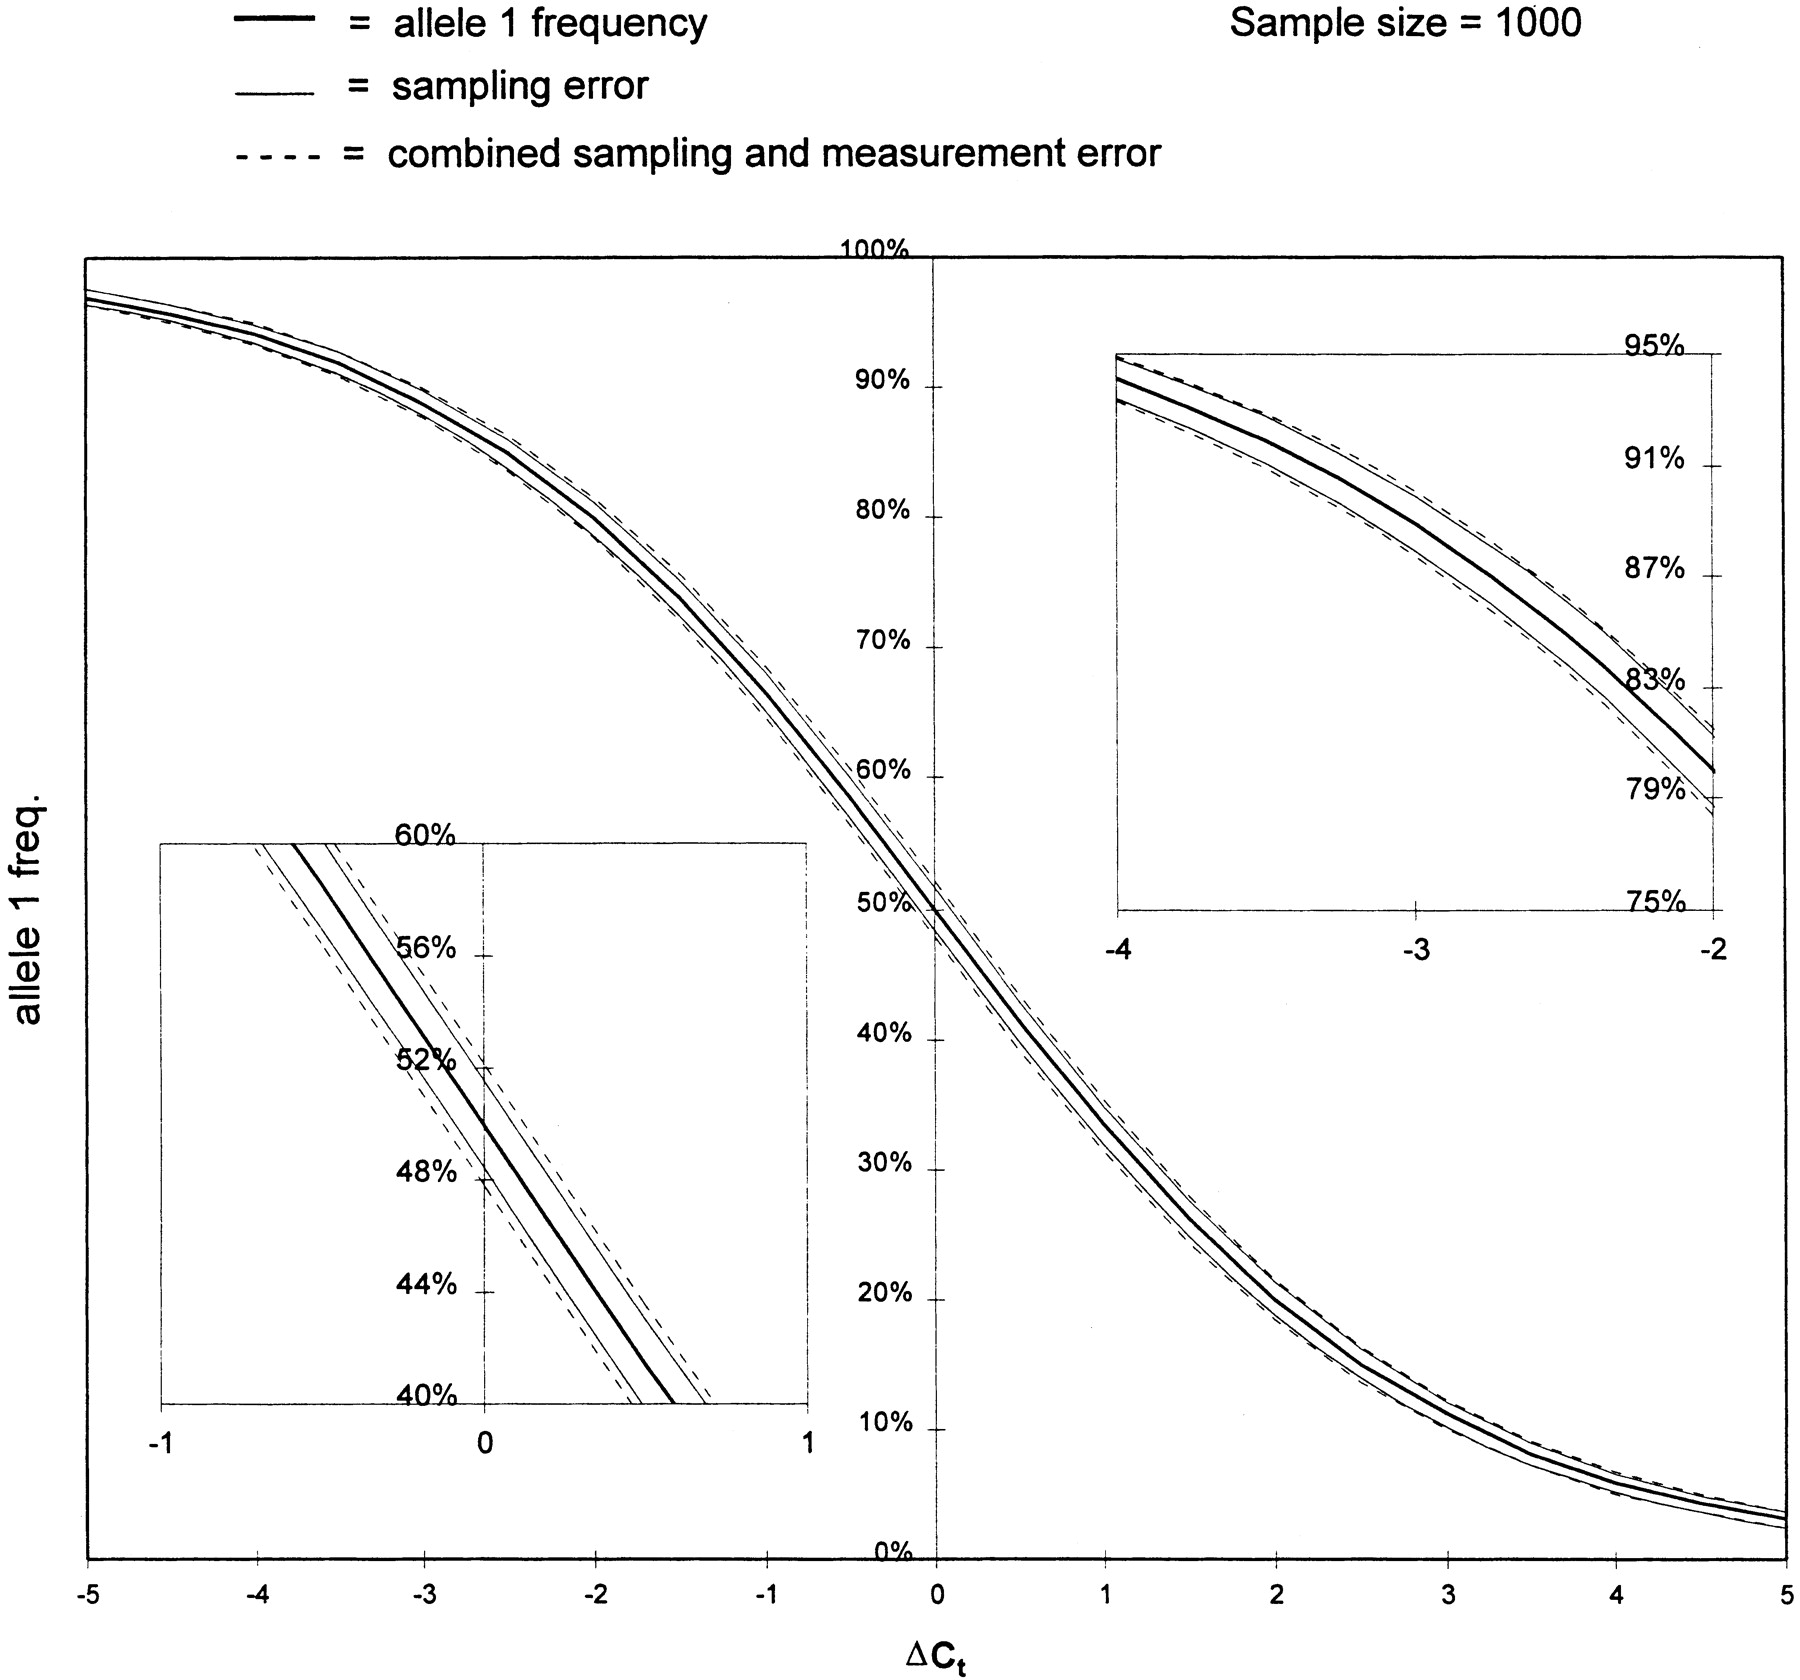
The relationship between ΔCt and allele frequency. The solid center line is a plot of equation 1 from the text. The flanking solid lines represent the expected uncertainty (1s.d.) in estimating the allele frequency based on sampling error alone (sample size = 1000). The broken lines represent the combined uncertainty of sampling and measurement error. The measurement error is based on an average error seen amongst the measurements taken in this paper and is that expected after averaging four replicate measurements. The insets compare the impact of measurement error at the middle and at the upper extreme of allele frequencies (the lower extreme should mirror exactly the upper).


