
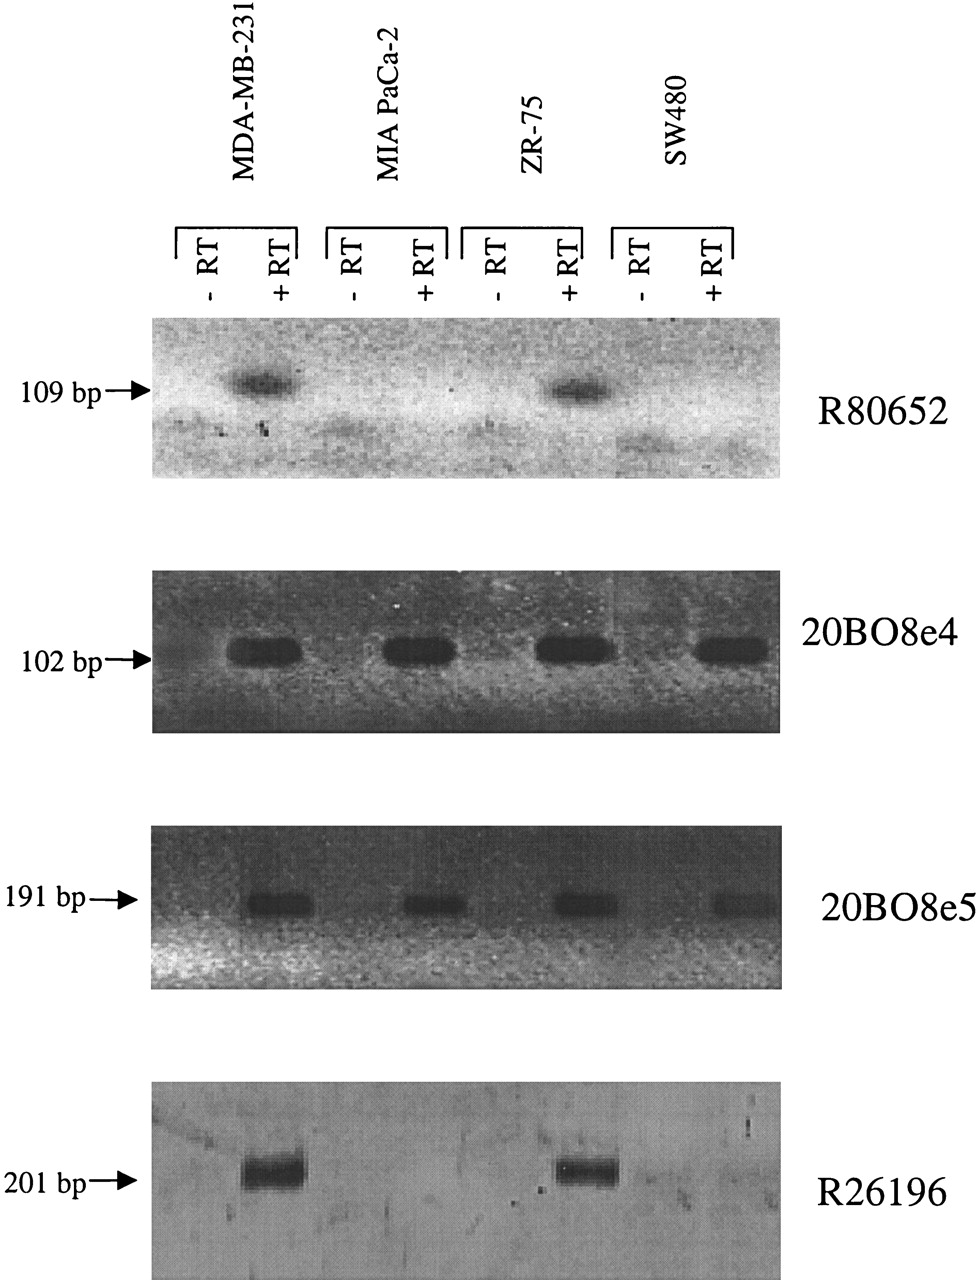
Figure 3.
Representative pictures of RT–PCR analysis on selected epithelial cancer cell lines. RT–PCR was performed on total cellular RNA. First-strand cDNA was synthesized using oligo(dT); PCR primers were designed from each partial cDNA clone. The lanes are as indicated. Control reactions without reverse transcriptase and reactions containing water were performed for every sample.


