
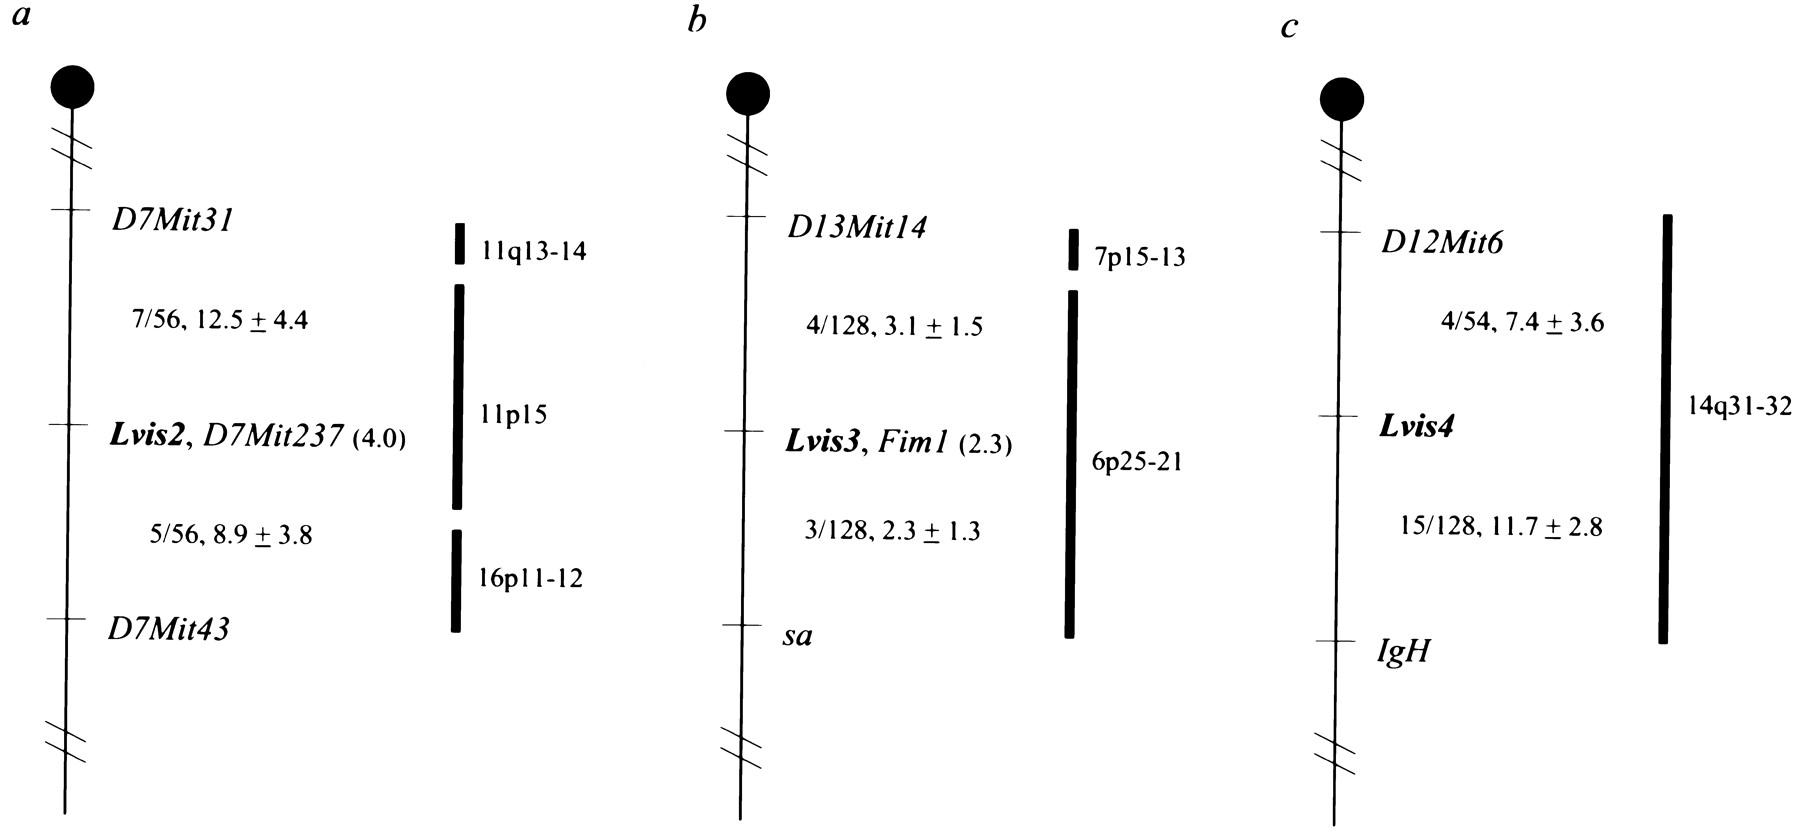
Meiotic mapping of Lvis2–Lvis4. Lvis viral insertion sites were mapped using an (SB/Le × M. spretus) F1 × SB/Le interspecific backcross previously typed for multiple markers on all mouse chromosomes (Justice et al. 1990). Partial linkage maps of chromosomes 7 (a), 13 (b), and 12 (c) are depicted. Ratios of the total number of mice exhibiting recombinant chromosomes to the total number of mice analyzed for each pair of loci (with map distances in centimorgans ± the standard error) are shown to the left of each chromosome. For markers that cosegregate, the upper 95% confidence interval is shown in parentheses. The predicted map locations of human orthologs are indicated to the right of each chromosome. References and additional information regarding human map locations can be obtained from the Mouse Genome Database (http://www.informatics.jax.org/).


