
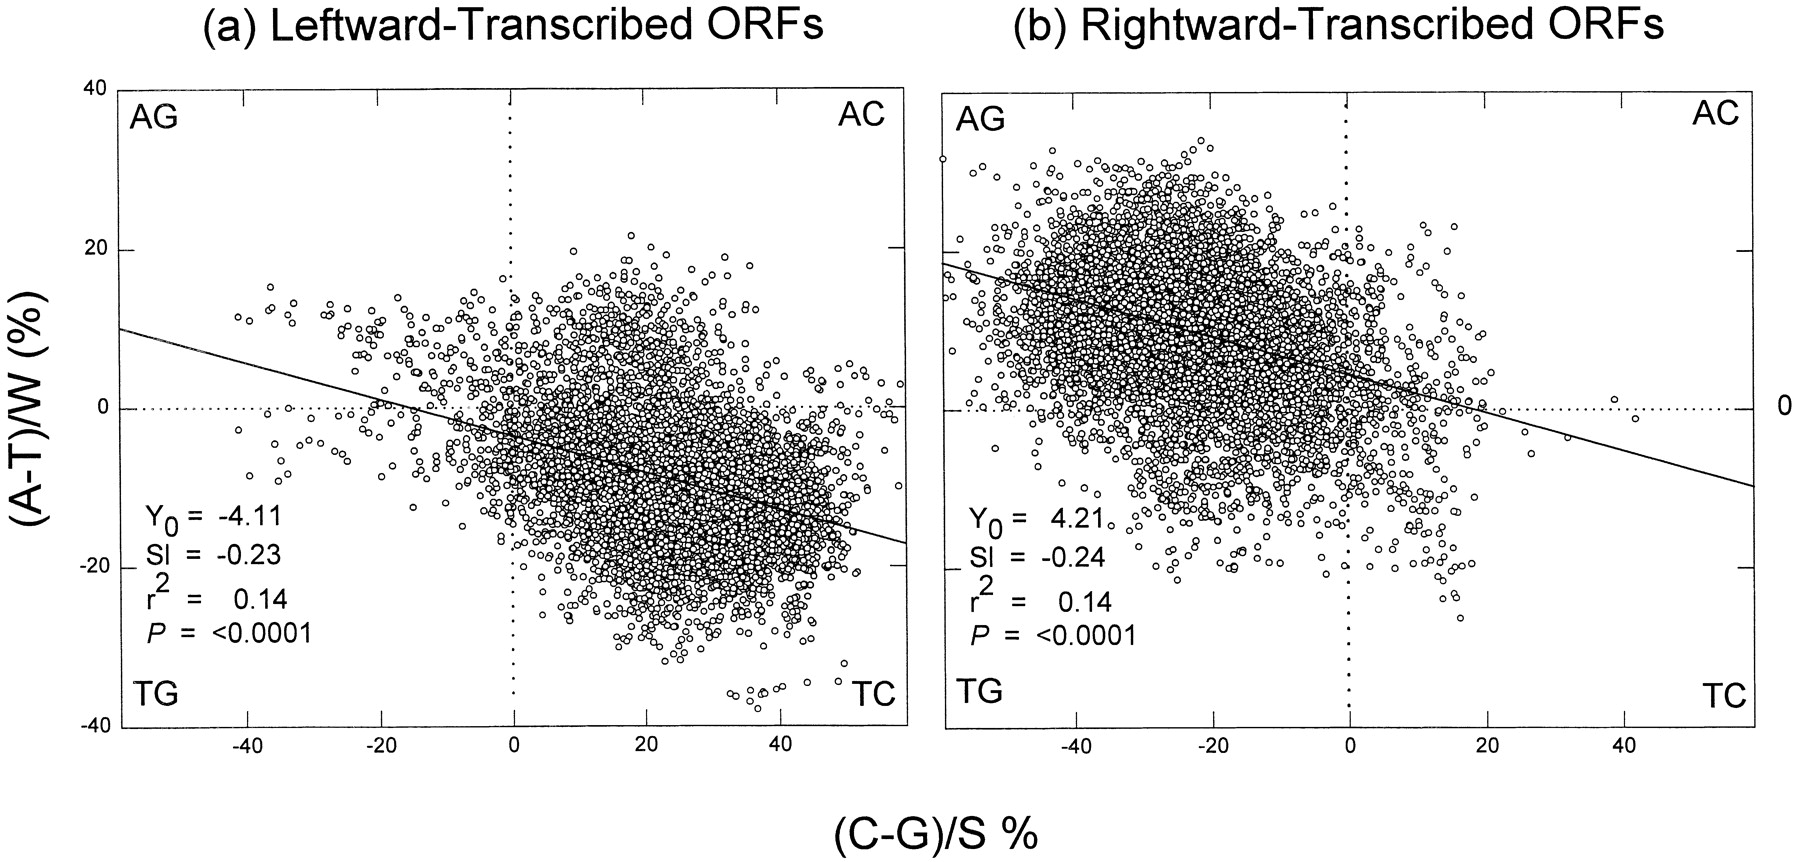
Quadrant analysis of Chargaff differences (%) for the W and S bases in 1-kb windows from the top strand of the M. jannaschii genome. Each quadrant corresponds to windows enriched for two particular bases, as indicated at the corners. (a) The 7494 windows whose centers overlap leftward-transcribed ORFs; (b) the 8202 windows whose centers overlap rightward-transcribed ORFs. The diagonal lines are the least squares regression lines. Listed are values for intercepts at the ordinate (Y 0), slopes (Sl), squares of correlation coefficients (r 2), and probabilities that slopes are not significantly different from zero (P). Similar values were obtained for plots using every tenth window to avoid window overlap (e.g., P < 0.0001).


