
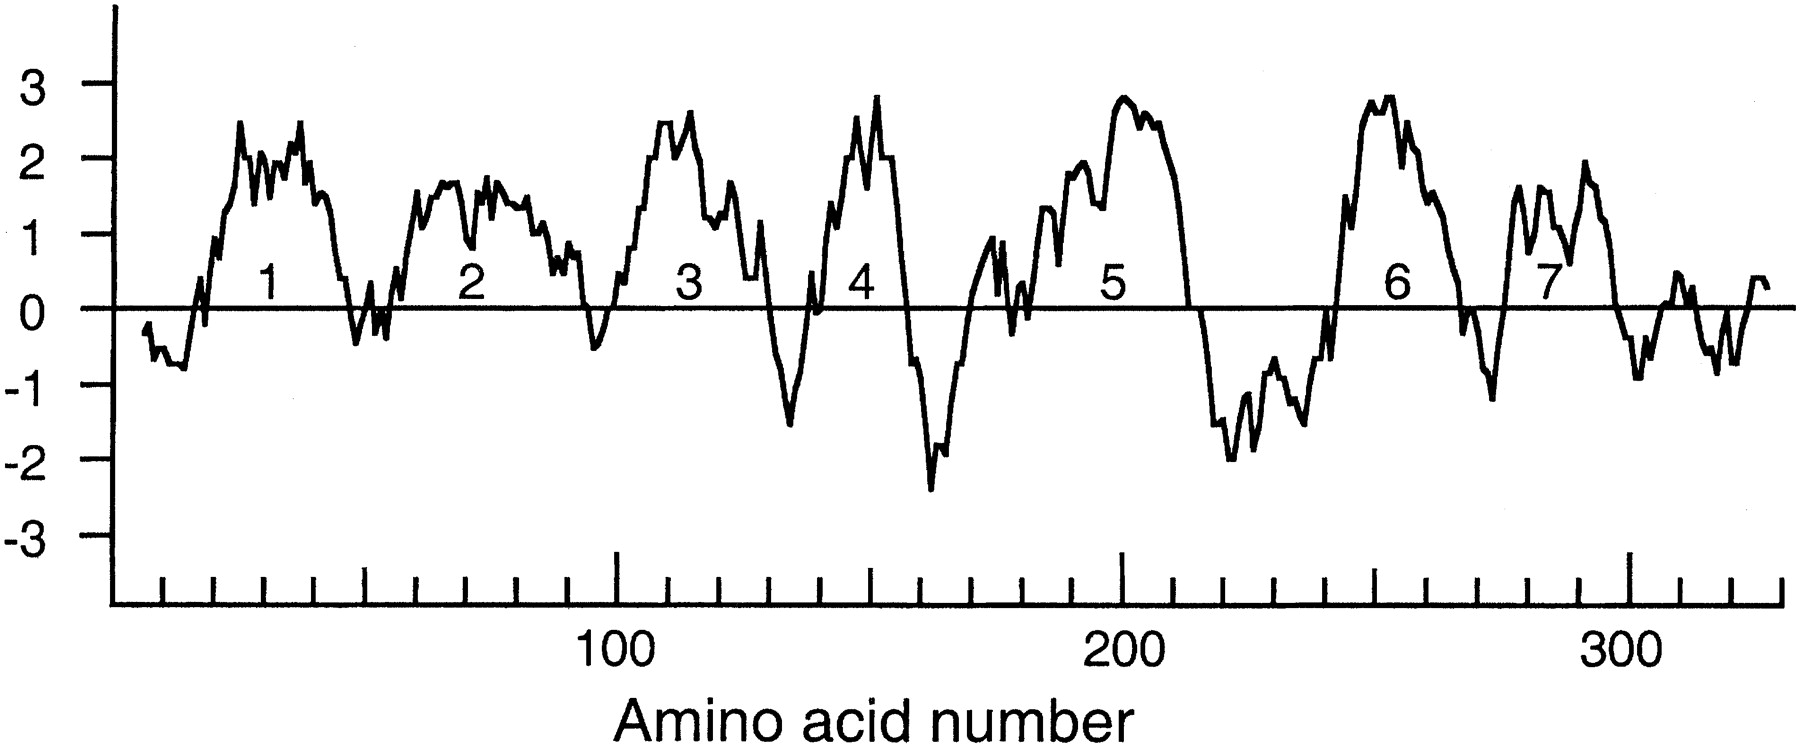
Figure 2.
Kyte-Doolittle hydrophobicity plot for the SRH-215/T20B3.3 protein. Transmembrane regions are numbered.
(Downloading may take up to 30 seconds. If the slide opens in your browser, select File -> Save As to save it.)
Click on image to view larger version.
Kyte-Doolittle hydrophobicity plot for the SRH-215/T20B3.3 protein. Transmembrane regions are numbered.
 CiteULike
 Delicious
 Digg
Digg Facebook
 Google+
 Reddit
 Twitter
