
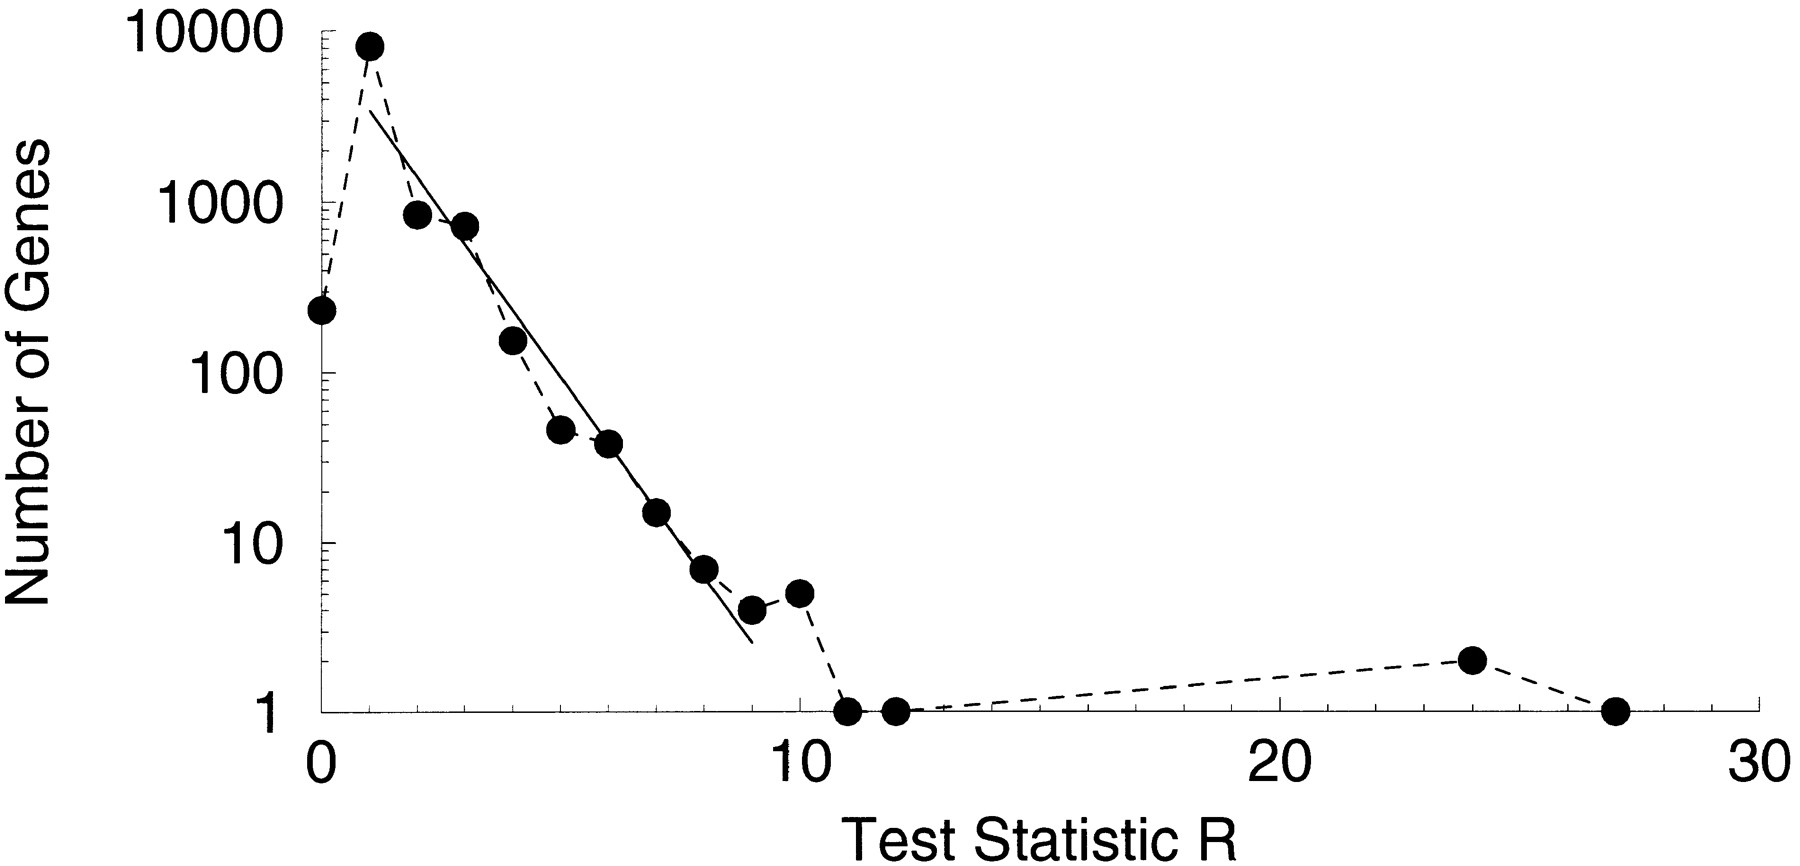
Figure 1.
The number of genes for a given value of the test statistic Ris plotted as a function of R. It can be seen that the data falls into two regions. For 1 ⩽ R ⩽ 9, the number of genes decreases exponentially with R. The solid line is the regression in this interval. The slope is −0.9 with standard error 0.07, and is therefore not significantly different from −1 at 5% significance. This is in accordance with the large deviations calculation described in the Methods section. When R > 9, the number of genes is above this exponential curve, and is much greater than predicted by the large deviations calculation.


