
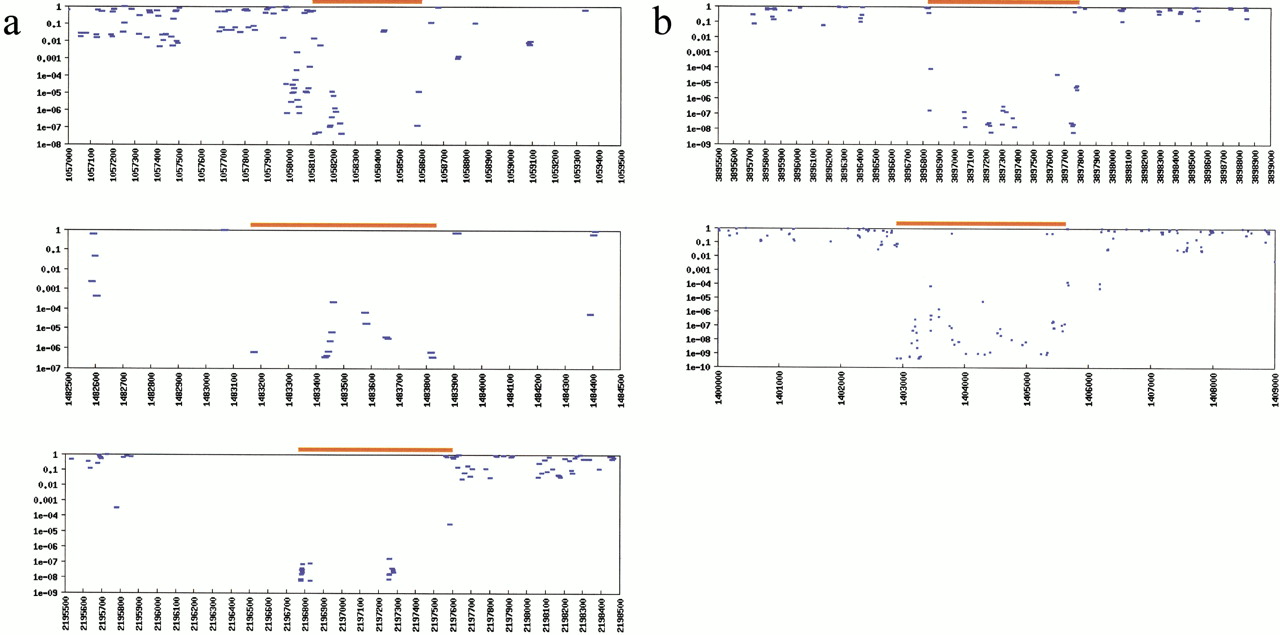
Figure 3.
Three falsely called deletions (a) show characteristic stacking and overlapping of PPGRs. These are called as a result of the incorrect assumption of independent ratio values in the function used to evaluate the probability of a set of values (equation 3). For comparison, two other shorter true deletions are shown (b).


