
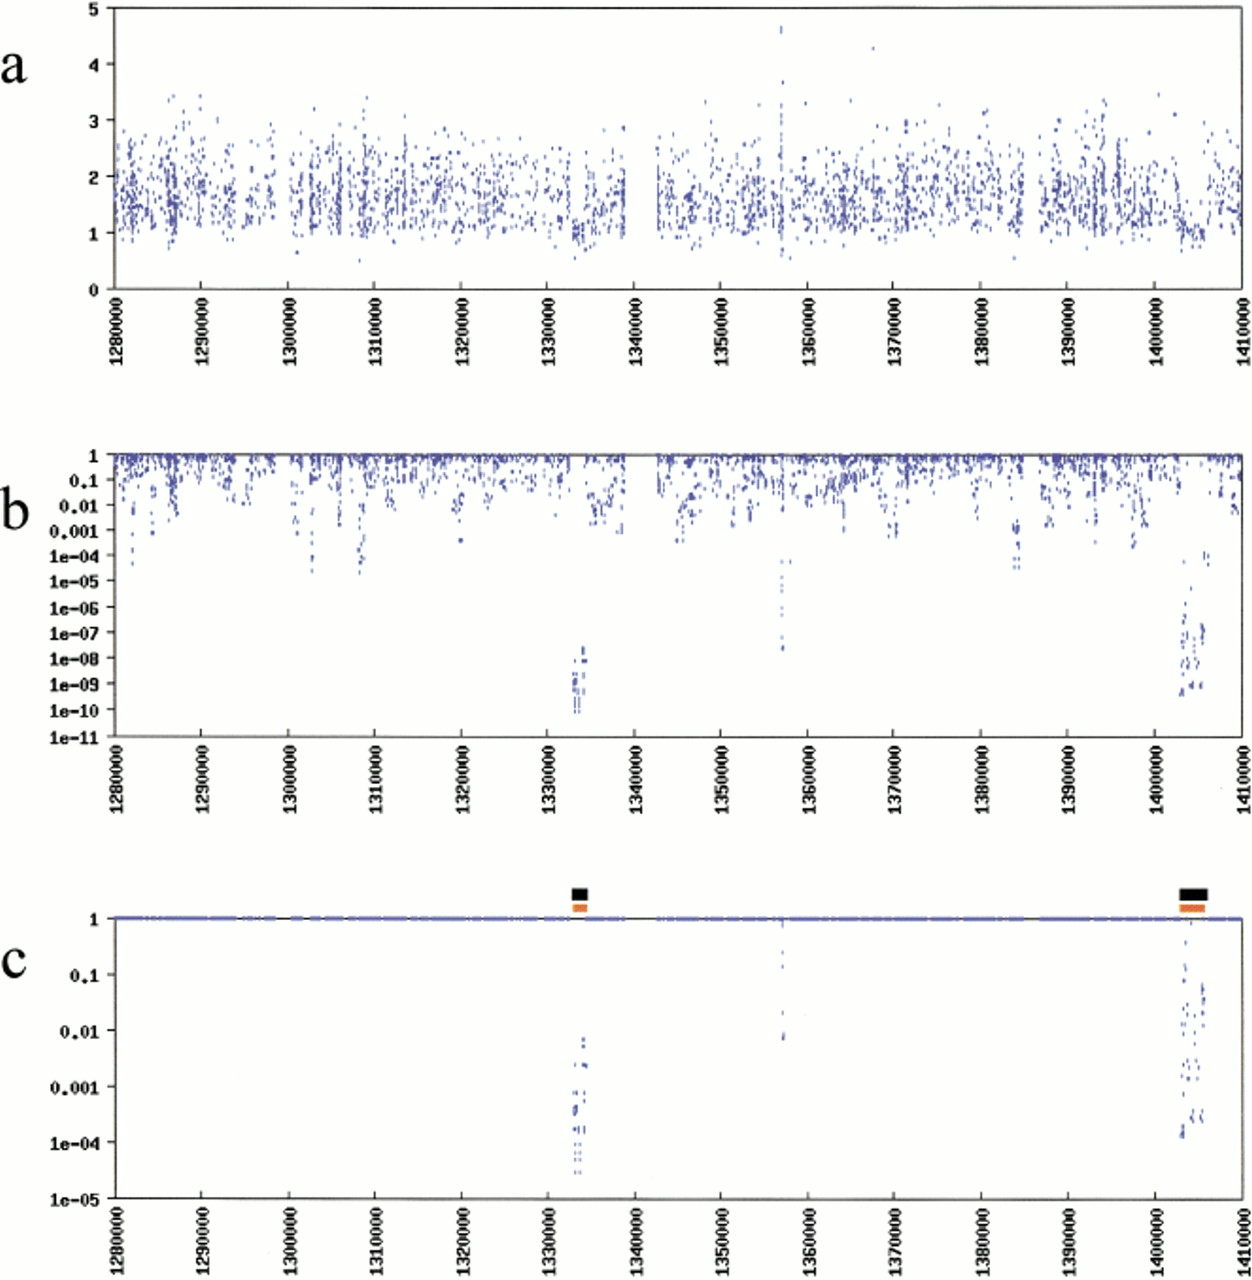
(a) Individual ratios of I PM toI MM (y-axis) plotted against genomic address (x-axis) reveal noise that masks deletions, hindering discovery. (b) The problem of identifying deleted regions is dramatically facilitated by investigating sets of tandem values using the TSTEP algorithm, which yields P values (y-axis) for each ratio. The x-axis is the same portion of the genome as in a. (c) Corrected P values, which account for testing more than 111,000 probe-pair hybridization ratios, are plotted against genomic address. Black bars indicate the regions of sequence-confirmed deletion. Orange bars indicate the regions predicted by a heuristic to assemble putative deletion intervals from P values calculated by TSTEP.


