
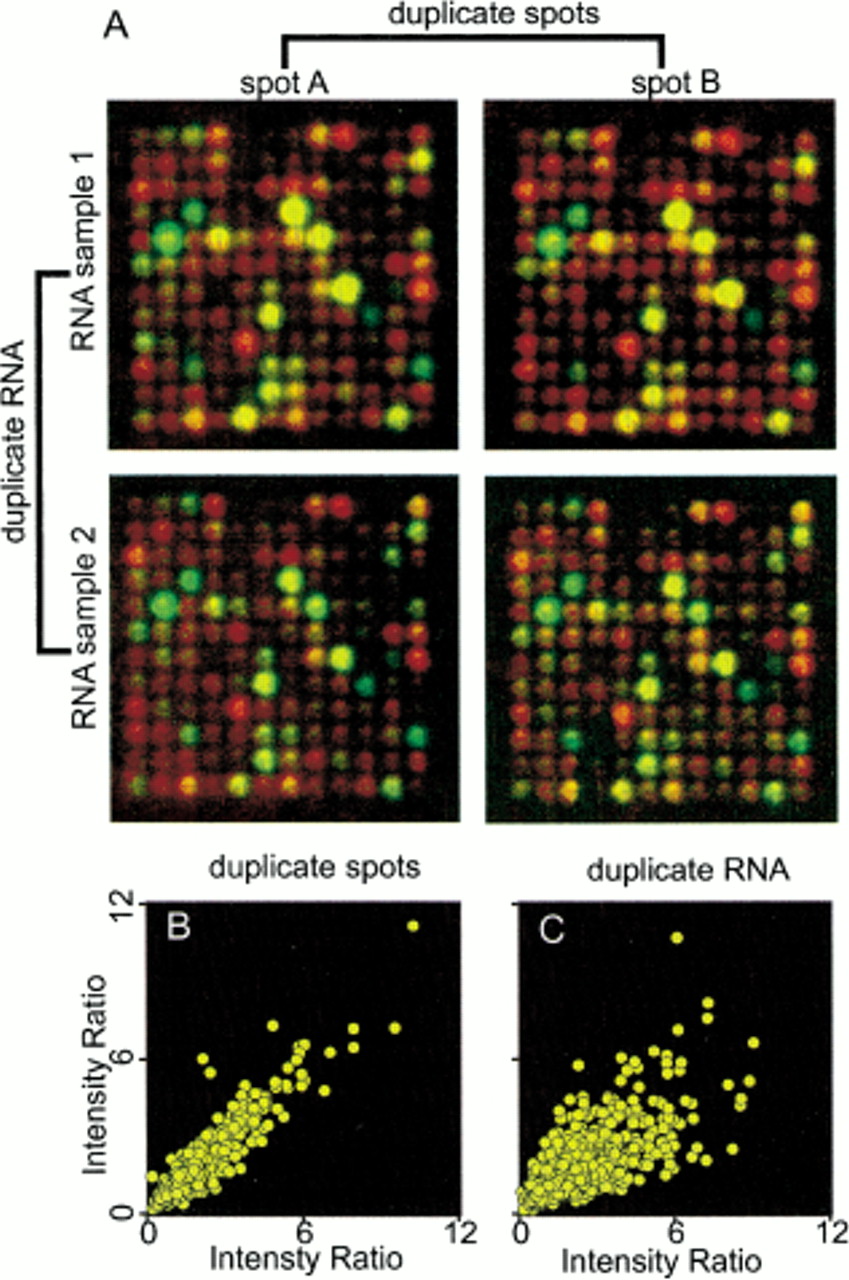
Reproducibility of microarray data. Data from duplicate experiments with radiolabeled cDNA from testis and gonadectomized male. (A) Merged, pseudoclored images of the same subarray from microarrays hybridized with radiolabeled cDNA from testis (red channel) and gonadectomized male (green channel). Duplicate spots are shown in the columns headed spot A and spot B. Results from duplicate experiments (independent tissue, RNA, reverse transcription, and hybridization) are shown in the rows labeled RNA sample 1 and RNA sample 2. (B, C) Scatter plots of hybridization intensity ratios. (B) Scatter plot of hybridization intensity ratios for duplicate spots (r 2= 0.97). (C) Scatter plot of hybridization intensity for duplicate RNA samples (values from duplicate spots were averaged, r2 = 0.68).


