
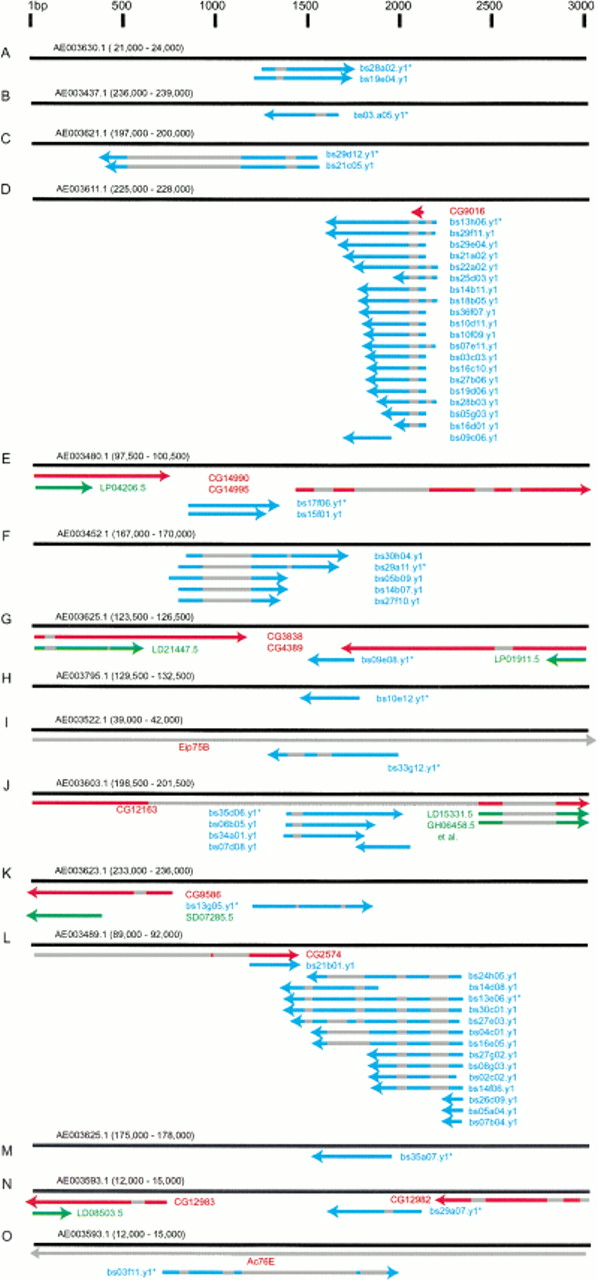
Figure 7.
Genomic regions flanking novel, microarray verified, testis transcription units. (A-O) Diagram of sequence alignment between the indicated 3-kb genomic sequences (black bars, coordinates in parentheses, scale at top) and testis ESTs (blue bars), BDGP ESTs (green bars) and known or predicted genes (red bars). The orientation of genes and ESTs are indicated (arrowheads), as are interrupted sequence alignments (gray bars), and the representative clone printed on the microarray (*).


