
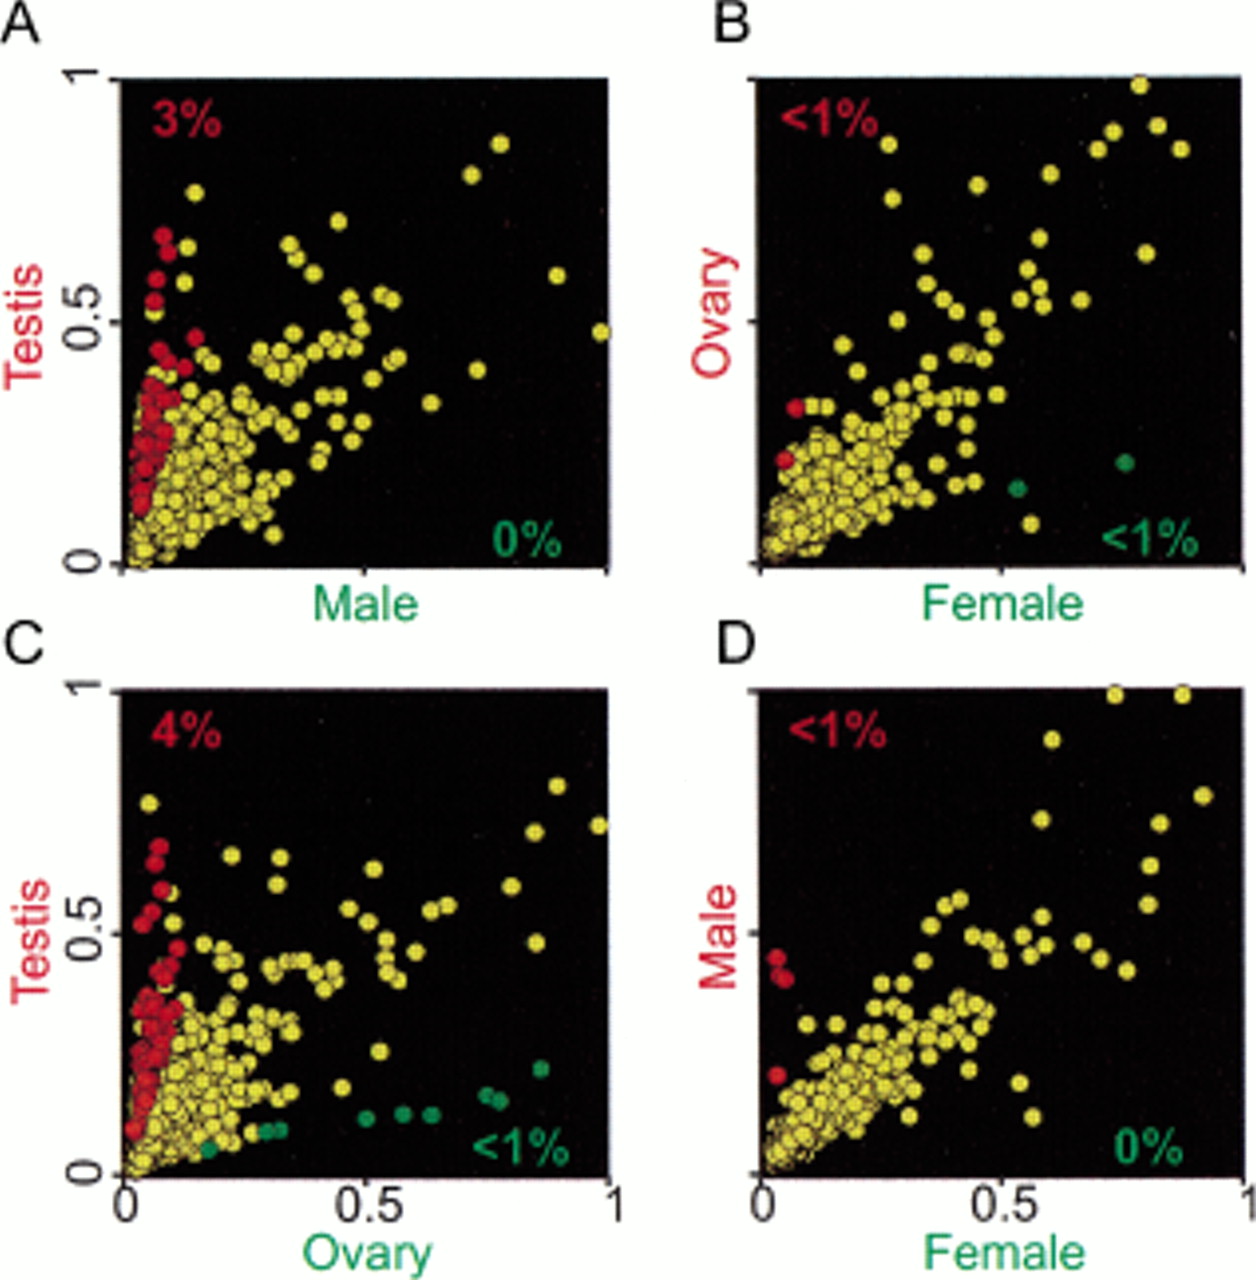
Statistically significant microarray intensity differences. Scatter plots of normalized microarray intensity values averaged from replicate experiments; the arbitrary scale is linear (see Methods). (A) Testis versus gonadectomized male, (B) ovary versus gonadectomized female, (C) testis versus ovary, and (D) gonadectomized male versus gonadectomized female. Individual data points (representing single cDNA microarray elements) that show statistically significant differences, P <0.05, and greater than a threefold intensity difference, are color coded red or green (corresponding to the color coded axis labels). The percentage of array targets satisfying this cutoff are given and are similarly color coded. Data points not satisfying these criteria are yellow.


