
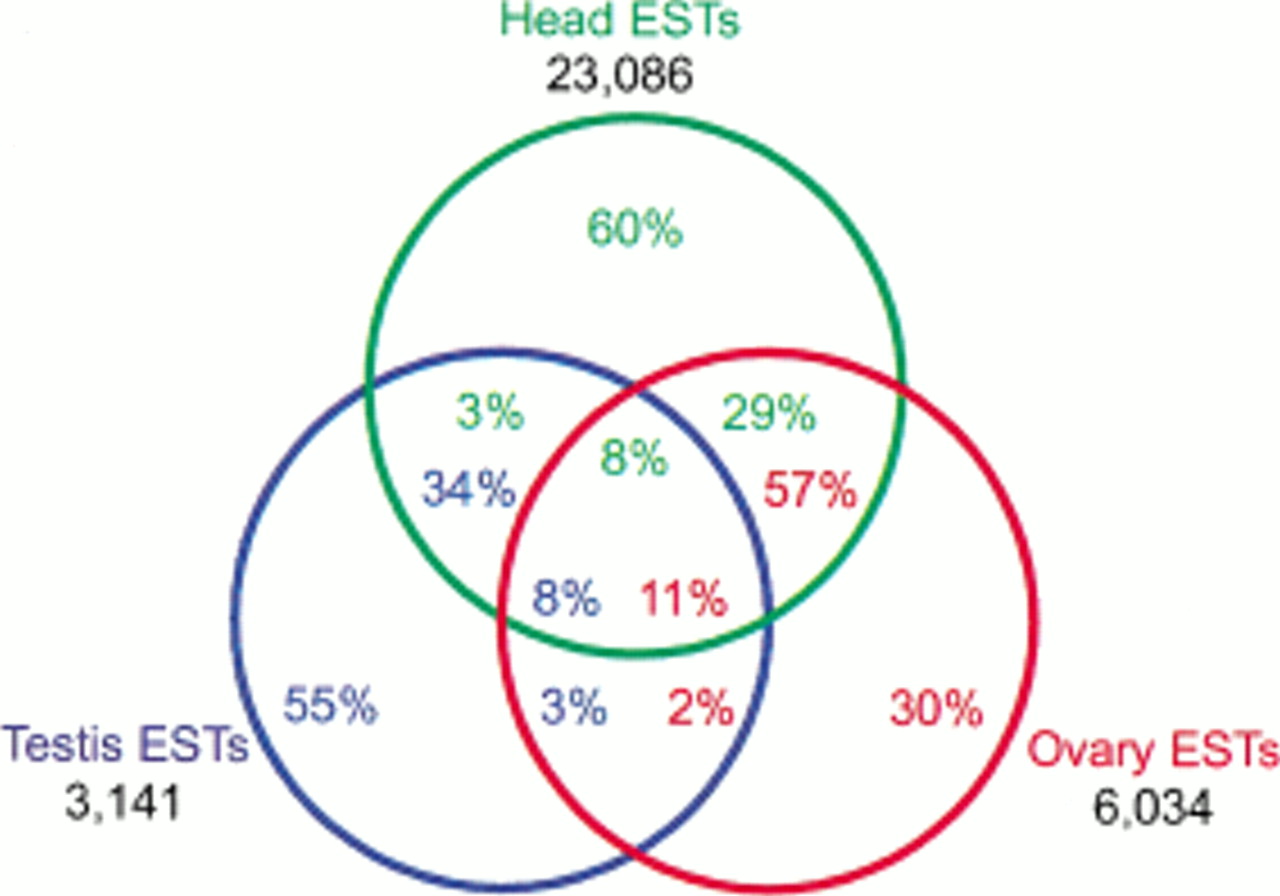
Three-way comparison of sequence matches between the testis, ovary, and head EST sets. All figure elements are color coded. 100% of testis (blue), ovary (red), and head (green) ESTs are within each color coded circle. The total number of ESTs in each collection is indicated. The color coded numbers show the percentage of ESTs from any of the three collections represented in the intersecting segments of the Venn diagram. For example, 60% of head ESTs are represented in only the head EST collection, 3% of head ESTs are represented in the head and testis EST collection, 8% of head ESTs are represented in all three EST collections, and 29% of head ESTs are represented in the head and ovary EST collections.


