
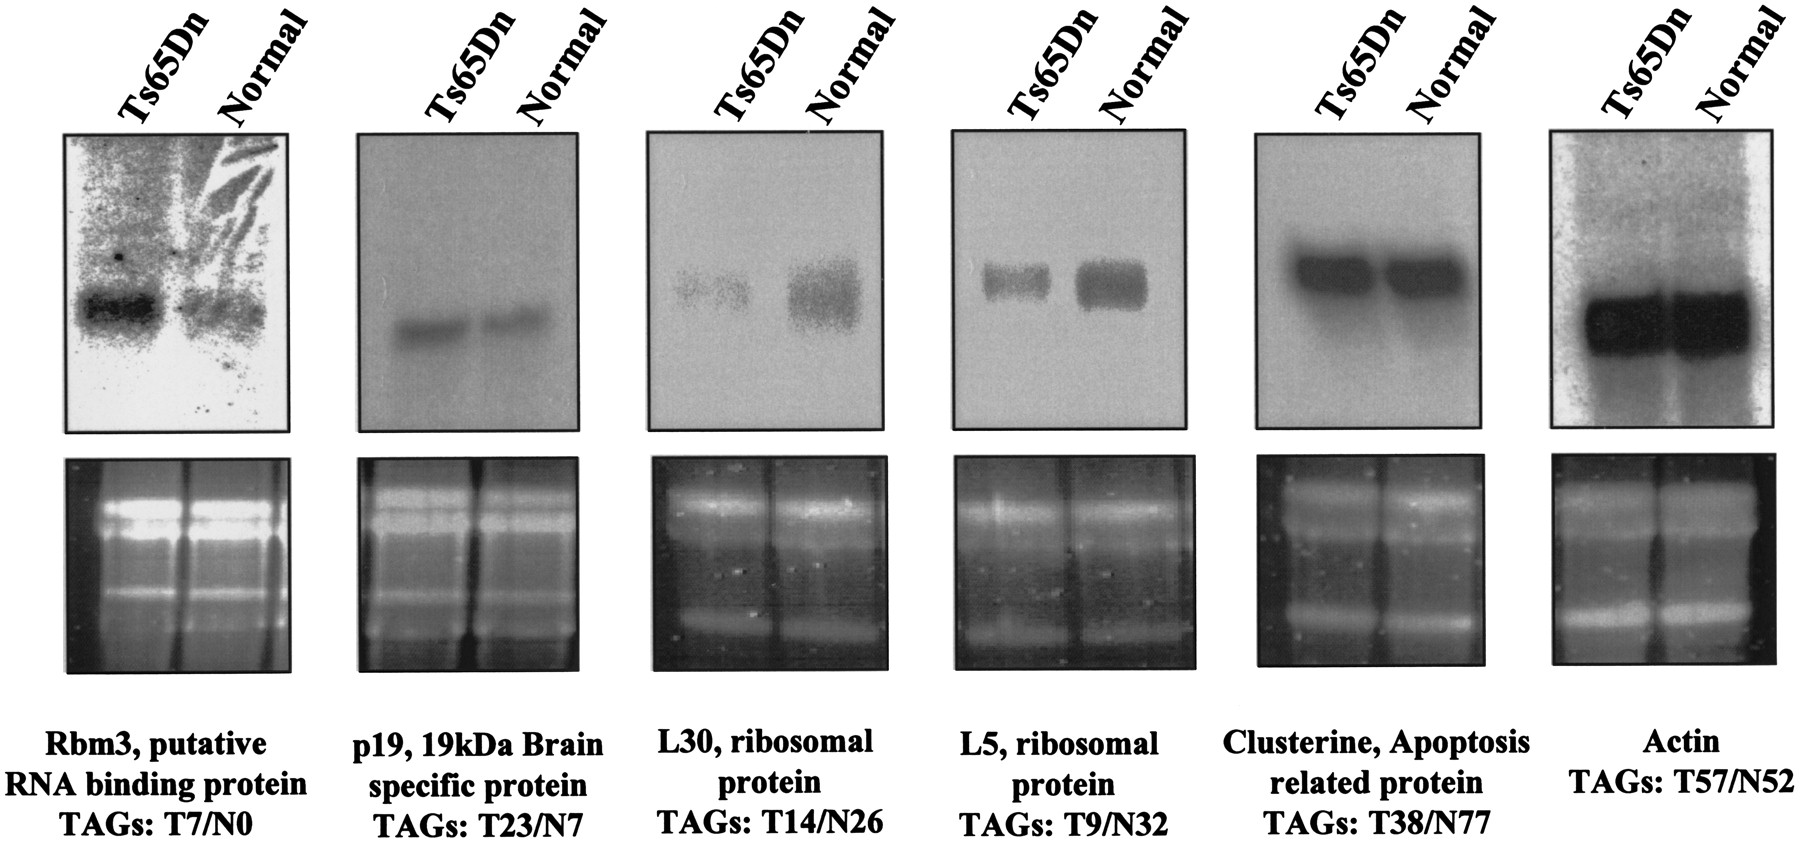
Northern blot analysis of some examples of differentially expressed genes between normal and Ts56Dn mouse serial analysis of gene expression (SAGE) libraries. Total RNA isolated from brain of four control males and four Ts65Dn male mice was blotted and hybridized with probes detecting Rbm3, p19, L30, and L5 ribosomal protein genes, clusterin, and actin transcripts. The top panel shows the results of autoradiography, the bottom panel shows the corresponding agarose gels prior to blotting (the two bands represent the 28S and 18S rRNAs). The number of tags detected in normal (N) and Ts65Dn (T) male SAGE libraries are also shown.


