
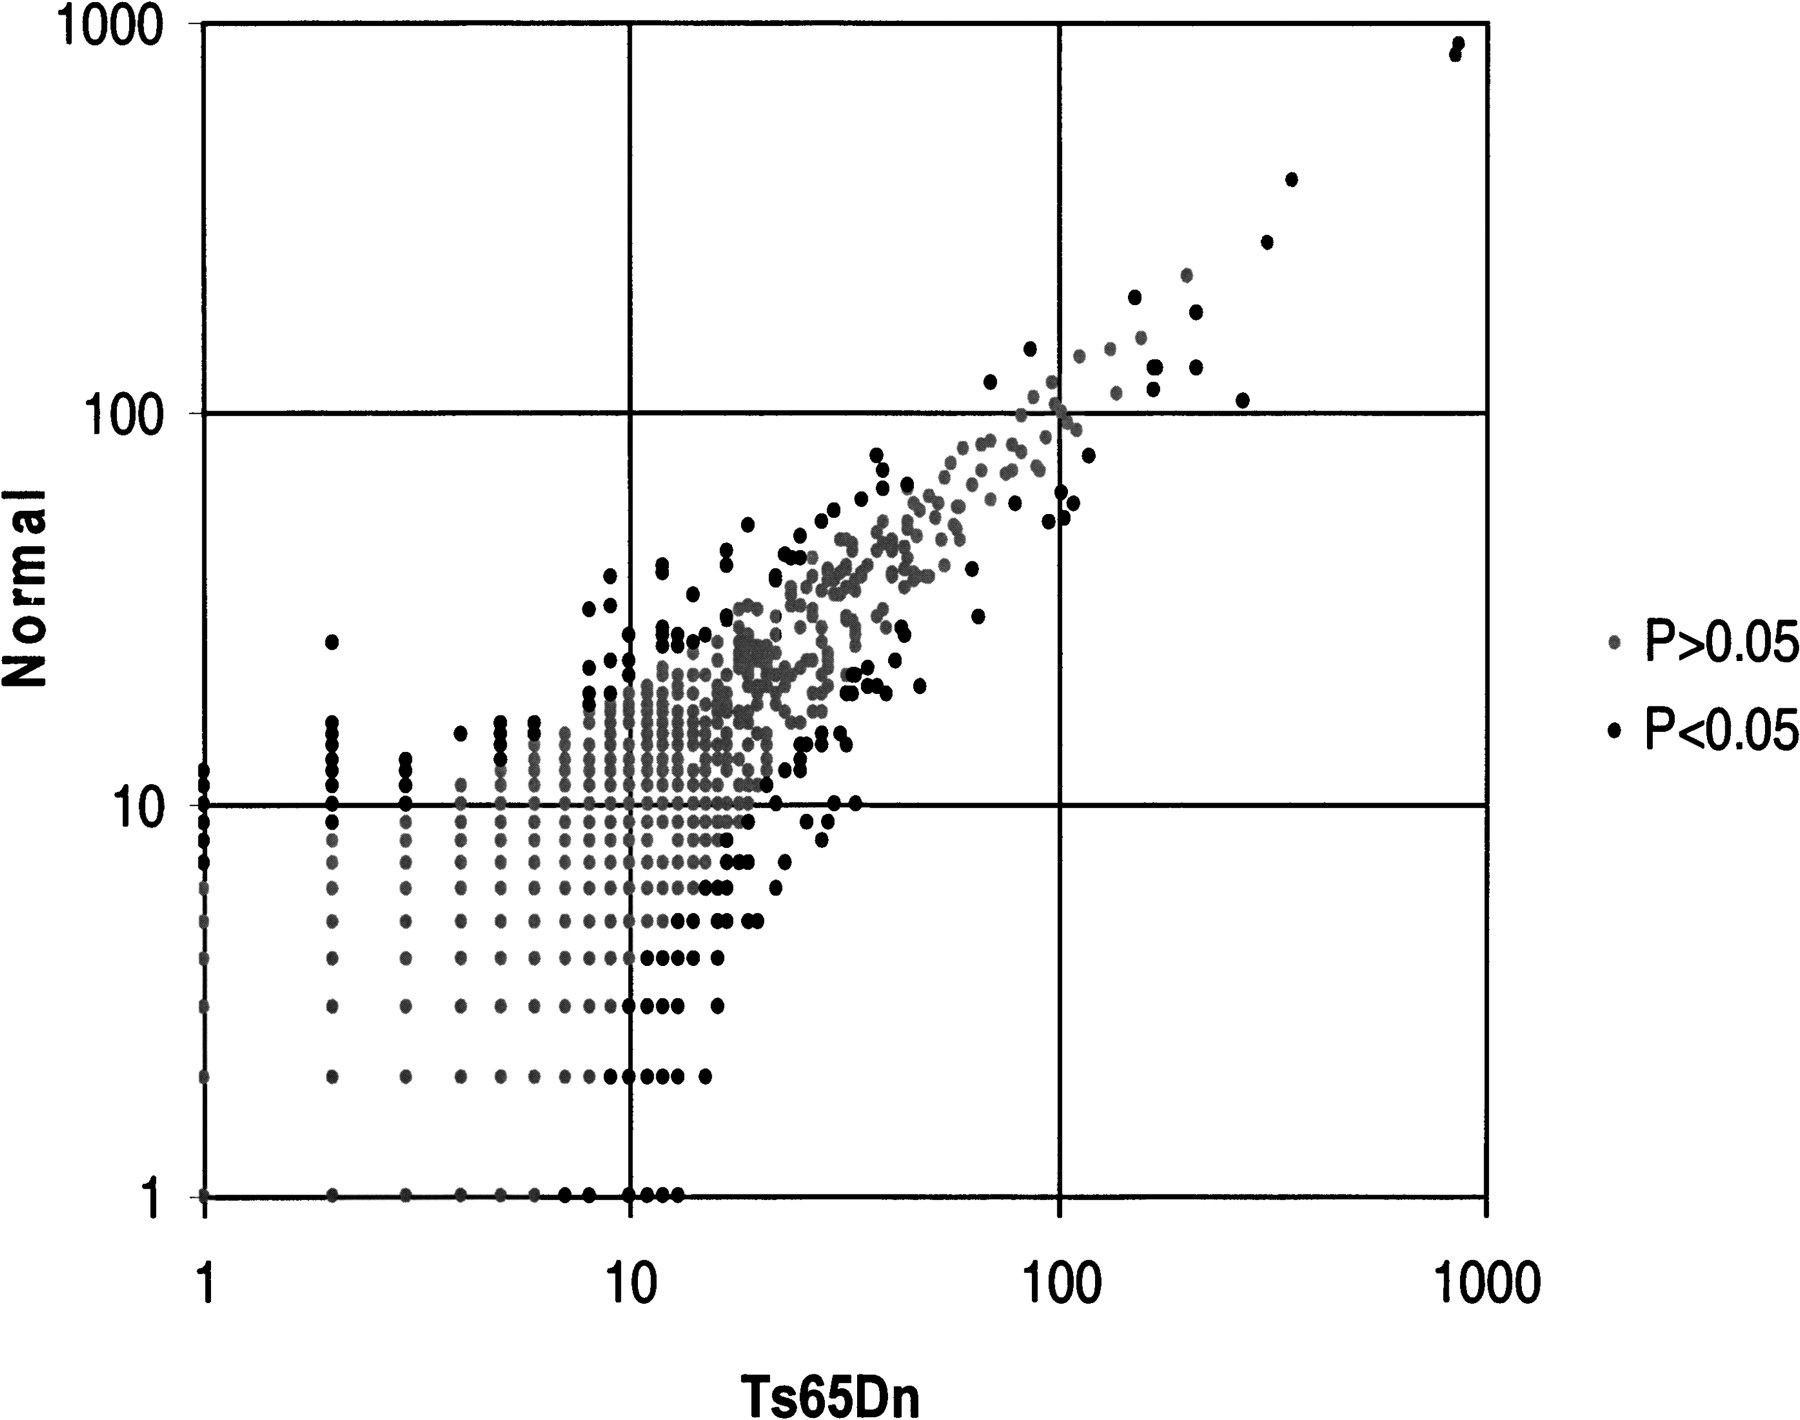
Figure 3.
Comparison of the observed frequencies of 36,012 unique tags detected after sequencing of ∼51,000 tags from each normal and Ts56Dn mouse serial analysis of gene expression (SAGE) libraries. The vast majority of the tags were expressed at the same or similar level in the two samples (gray circles); however, there were 330 tags with statistically significant differences (P < 0.05) between normal and Ts56Dn mouse SAGE libraries (black circles).


