
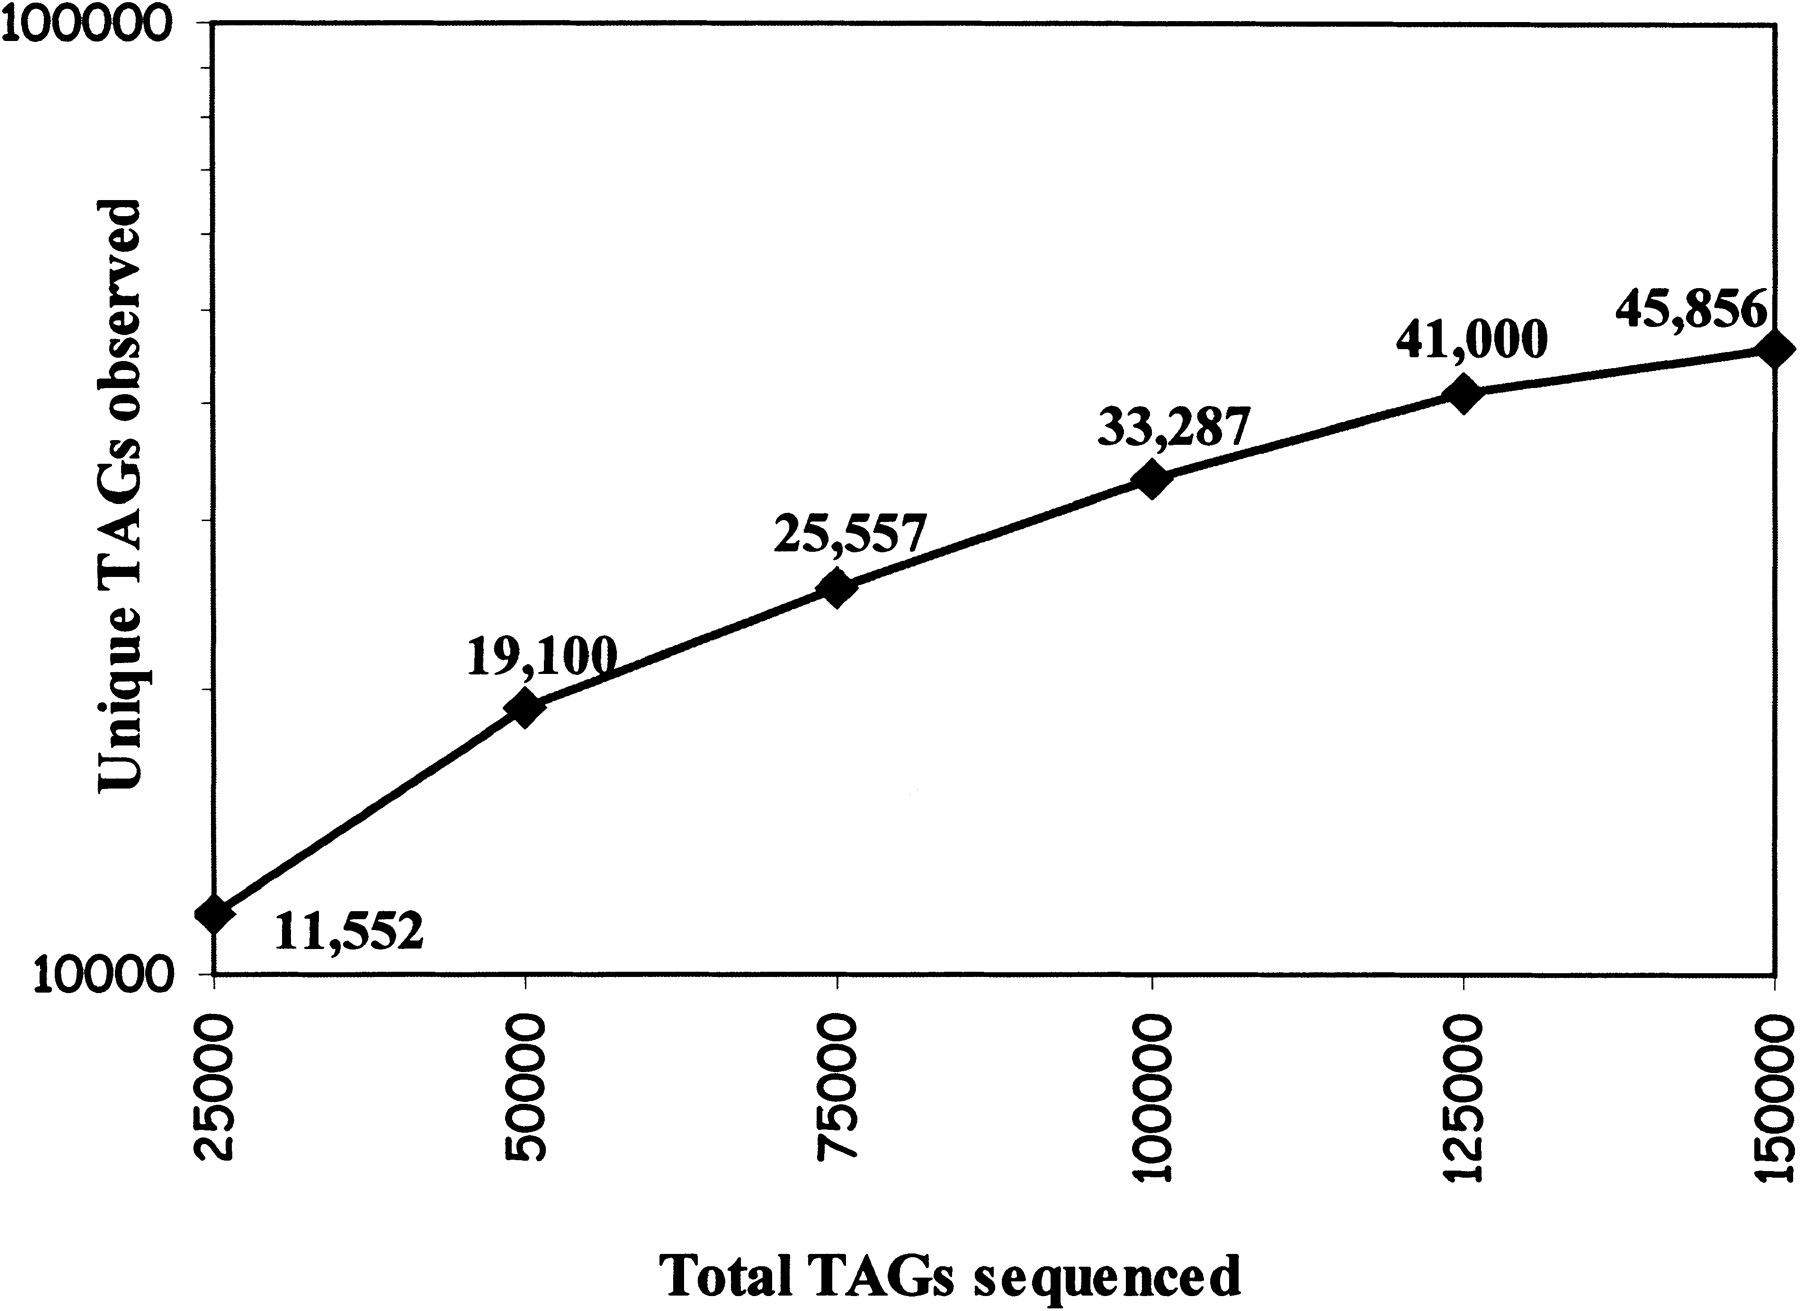
Figure 1.
Cumulative curve of unique tag detection through sequencing of 152,791 tags from normal male and Ts65Dn male and normal female mice brain serial analysis of gene expression (SAGE) libraries. A total of 22,115, 21,357, and 19,103 unique tags were detected after sequencing 51,561, 50,504, and 50,726 tags from normal male, Ts65Dn male, and normal female mice brain SAGE libraries, respectively.


