
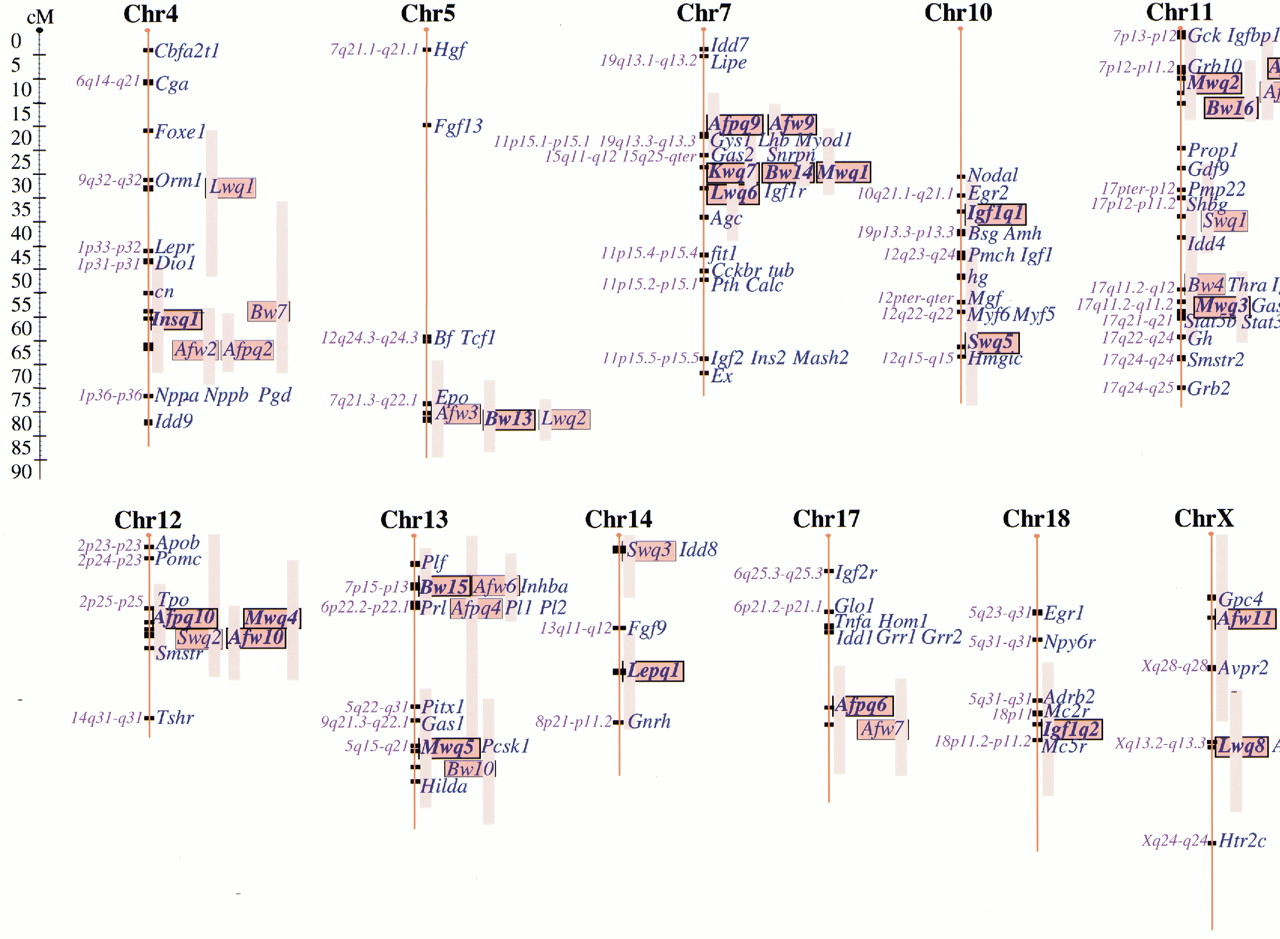
Depiction of chromosomes harboring QTLs newly identified in this study. QTL symbols of newly identified QTLs were labeled in bold text in the last column of Table 5. Shown are the chromosomal positions and confidence intervals of significant QTLs for body weight (Bw*), abdominal fat weight (Afw*), abdominal fat percentage (Afpq*), muscle weight (Mwq*), liver weight (Lwq*), kidney weight (Kwq*), spleen weight (Swq*), leptin (Lepq*), insulin (Insq*), and IGF-I (Igf1q*) relative to map positions of candidate genes for the QTL effects. Candidate genes were taken from the Mouse Genome Database (MGD), section endocrine defects, hormones, growth, and obesity (MGD), and from the Human Obesity Gene Map (Chagnon et al. 2000). The human homology is shown on the left side of every chromosome.


