
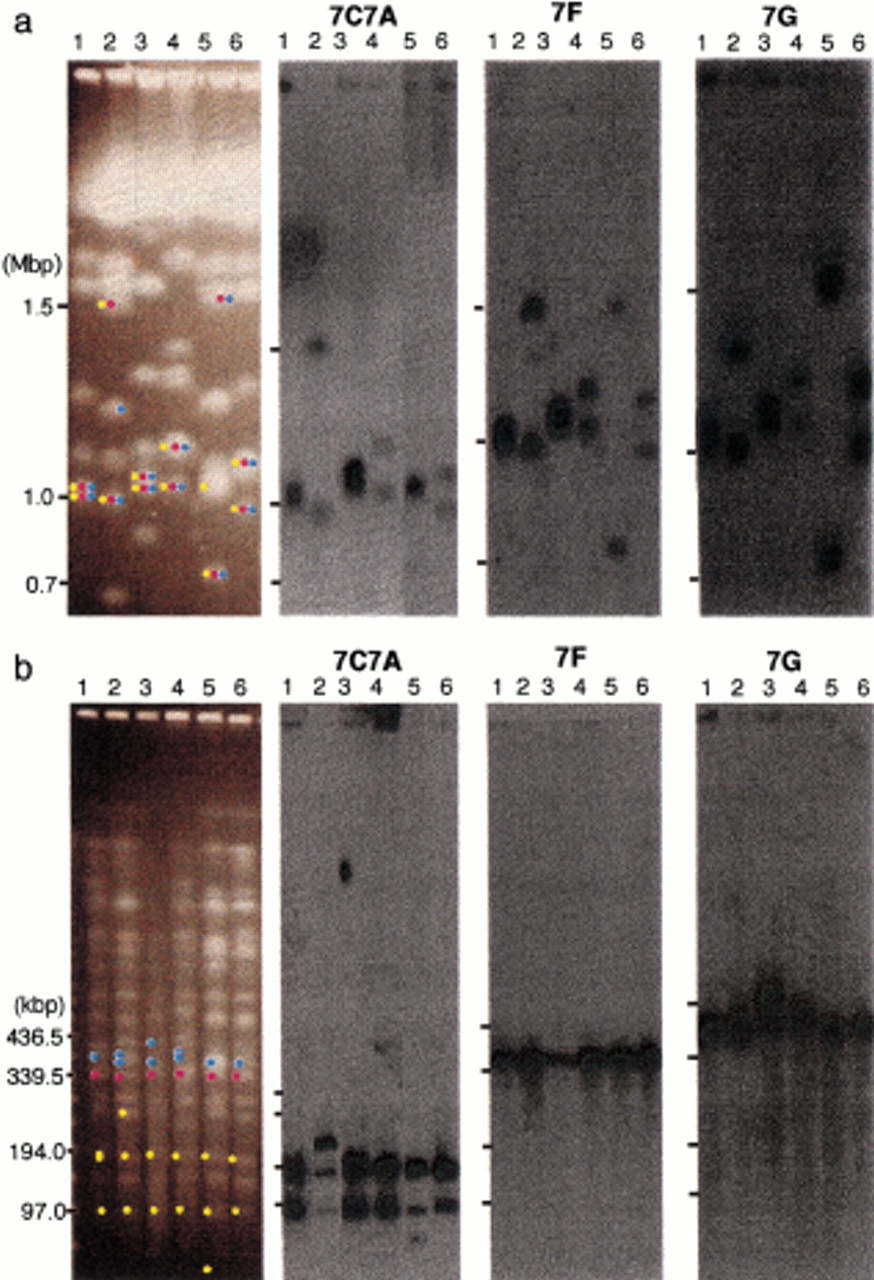
Hybridization of the fosmid contiguous sequence (contig) probes to intact chromosomes and to SfiI fragments. The Southern hybridization profiles with fosmid contig probes 7C–7A, 7F, and 7G are shown. The gels on the left are marked with colored dots that show which bands correspond to the hybridization profiles on the right. Yellow, red, and blue dots indicate gel bands that hybridize with the 7C–7A, 7F, and 7G contigs, respectively. Karyotypes of six different strains are shown: lane 1, 1006; lane 2, WO-1; lane3, NUM55; lane 4, NUM114; lane 5, NUM1000; lane 6, 1719. Hybridization to intact chromosomes: The three bars at the left of each image indicate 1.5 Mbp, 1.0 Mbp, and 0.7 Mbp, respectively. The size was estimated with intact chromosomes ofSaccharomyces cerevisiae and Lambda ladder DNAs (a). Hybridization to SfiI restriction fragments: The four bars at the left of each image indicate 436.5 kbp, 339.5 kbp,194.0 kbp, and 97.0 kbp, the sizes of Lambda ladder DNAs (b).


