
Figure 1.
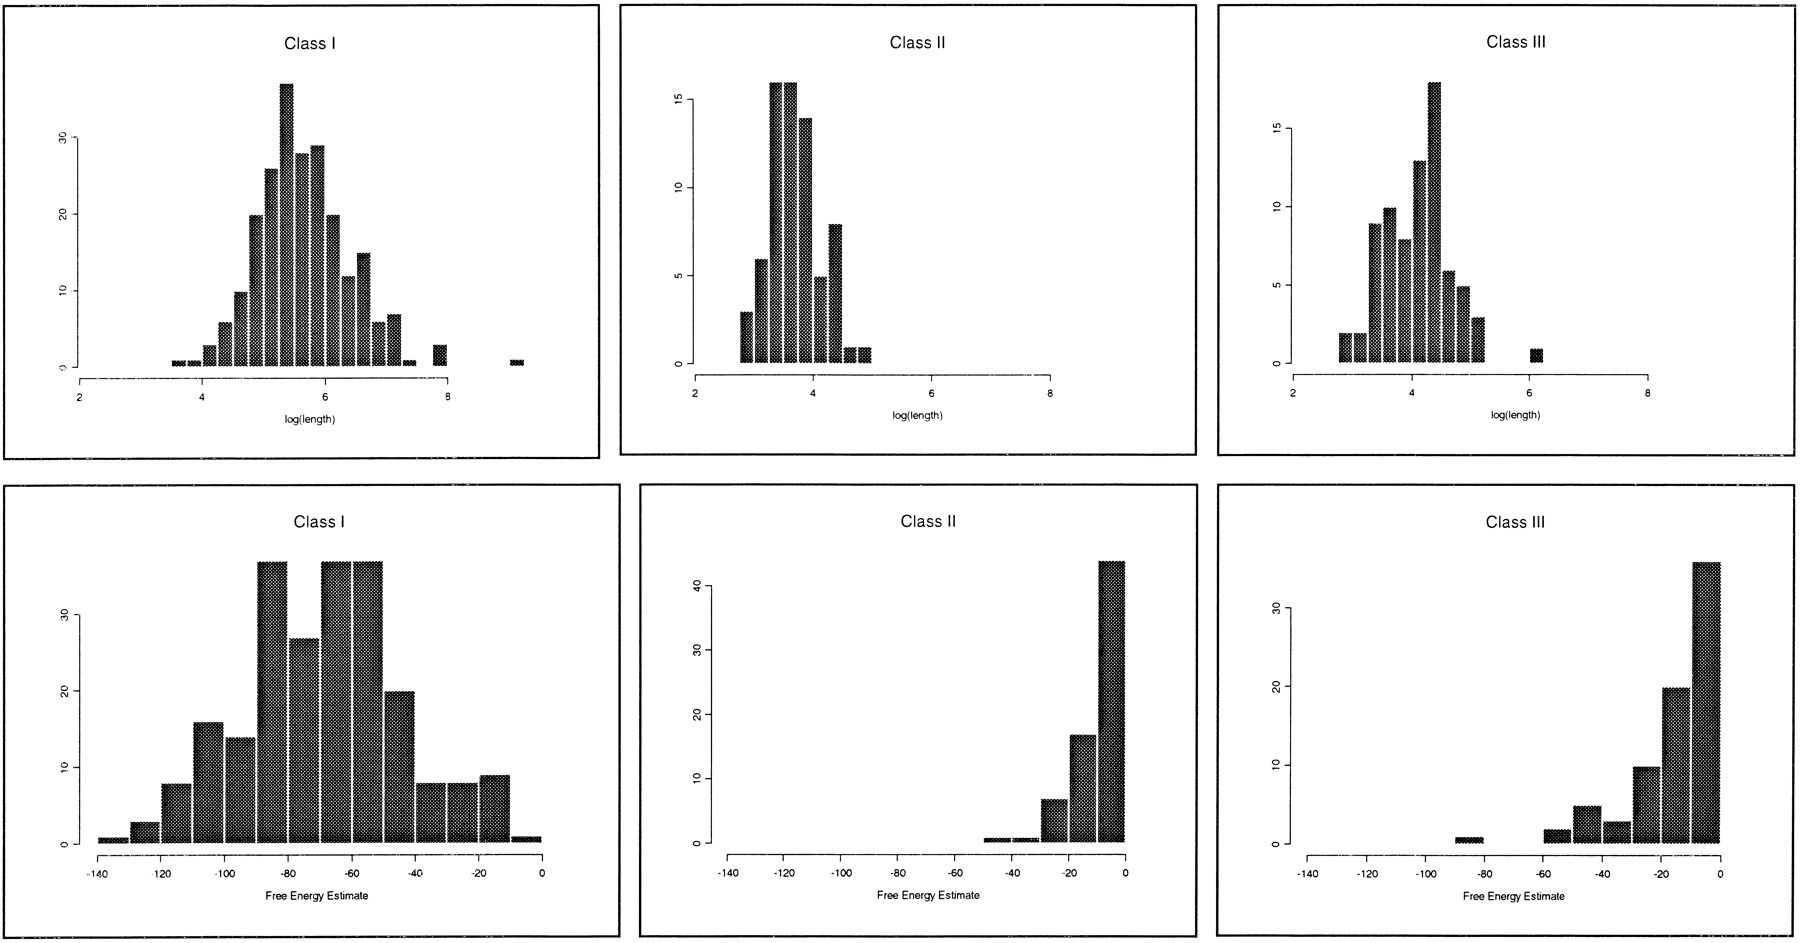
(Top) 5′ UTR length distributions. (Bottom) Free energy distributions (ΔG in kcal/mole).
(Downloading may take up to 30 seconds. If the slide opens in your browser, select File -> Save As to save it.)
Click on image to view larger version.
(Top) 5′ UTR length distributions. (Bottom) Free energy distributions (ΔG in kcal/mole).
 CiteULike
 Delicious
 Digg
Digg Facebook
 Google+
 Reddit
 Twitter
