
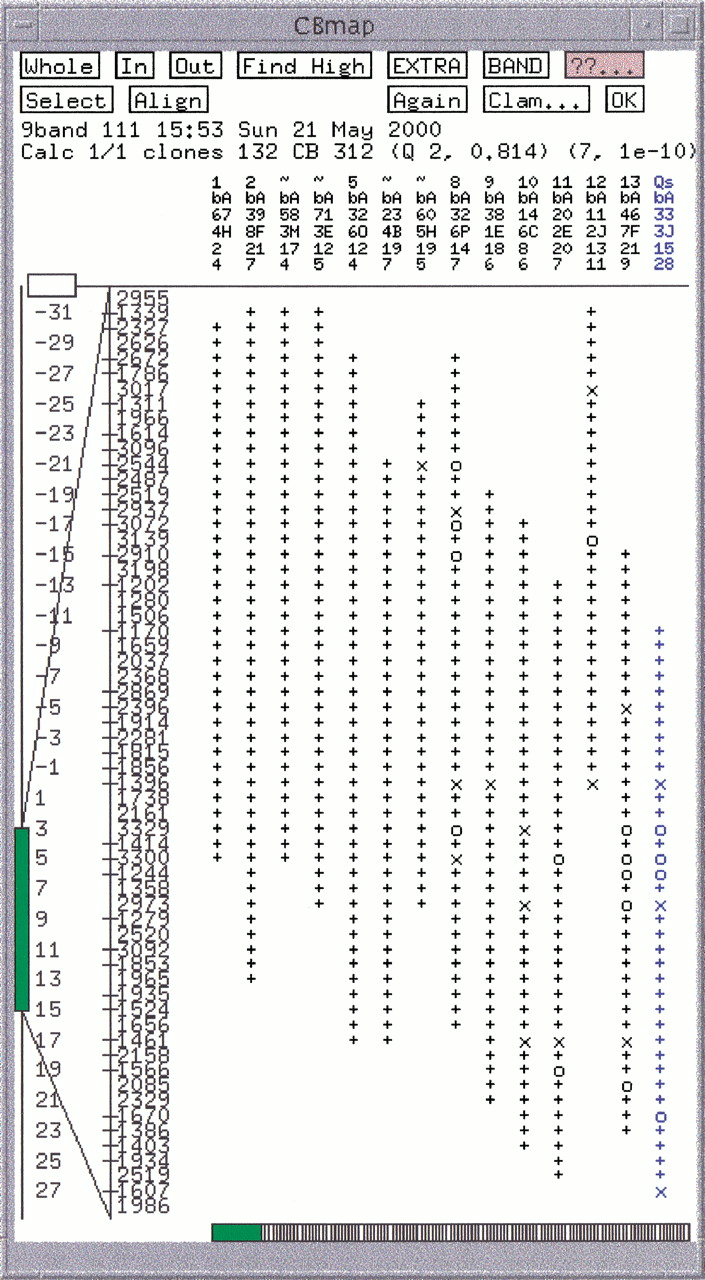
Figure 2.
Consensus band map. In the top row, an = (not shown) or a ˜ indicates a potential exact or approximate buried clone, respectively. Qs indicates a Q (questionable) clone. The next three rows are the clone name. The last row is the number of extra bands that could not be placed. Below these four columns is a set of +, × , and 0. The + signs indicate a band within the tolerance of the consensus band to the right. The × indicate a band within twice the tolerance of the consensus band. The 0 indicate no band within the tolerance.


