
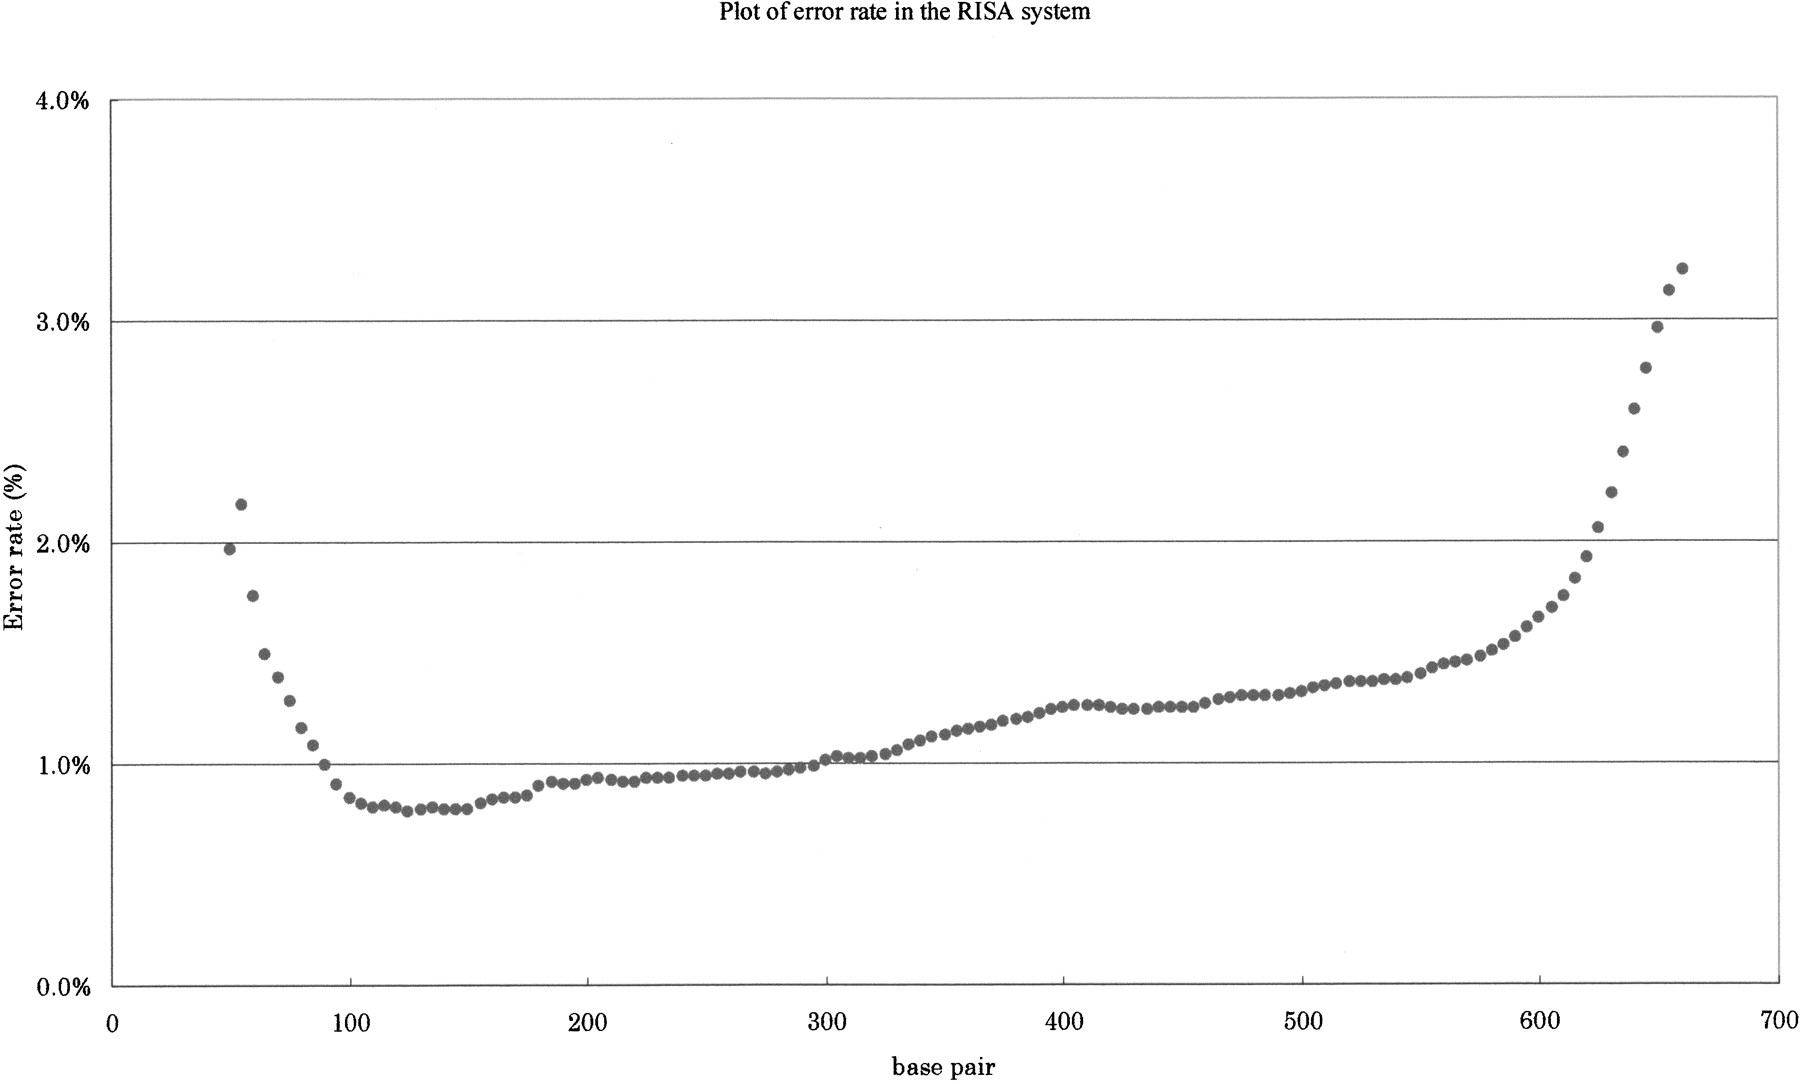
Figure 4.
Error rate distribution of sequences using the RISA system. The template was pGEM–3ZF(+) plasmid DNA. A homology search was performed using FASTA ver. 3.2t09. The error rate at each position of the sequenced DNA is plotted. The vertical axis represents the percentage of misreading of the DNA fragment from primer to the position.


