
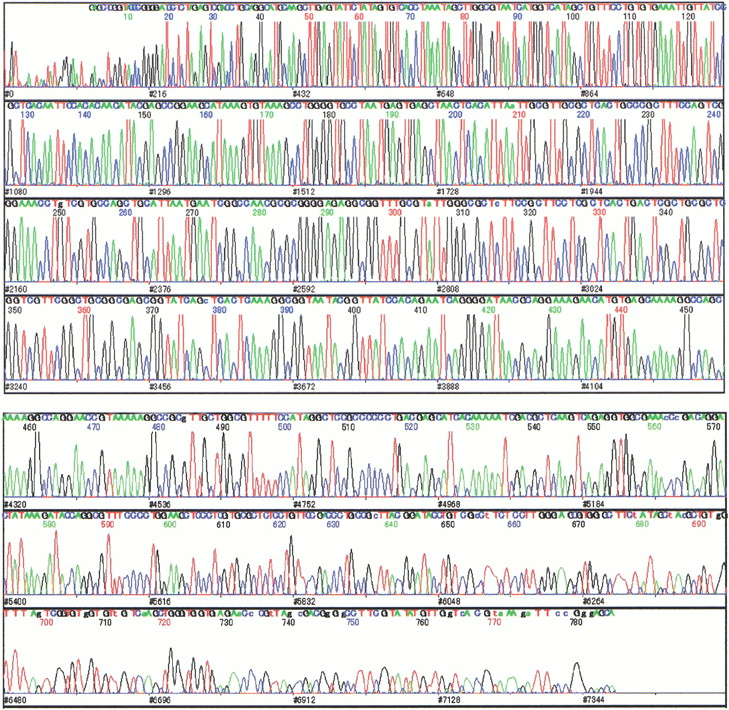
Figure 2.
Analyzed and base-called electropherogram. The horizontal axis represents the scan number and the vertical axis gives the relative amplitude.
(Downloading may take up to 30 seconds. If the slide opens in your browser, select File -> Save As to save it.)
Click on image to view larger version.
Analyzed and base-called electropherogram. The horizontal axis represents the scan number and the vertical axis gives the relative amplitude.
 CiteULike
 Delicious
 Digg
Digg Facebook
 Google+
 Reddit
 Twitter
