
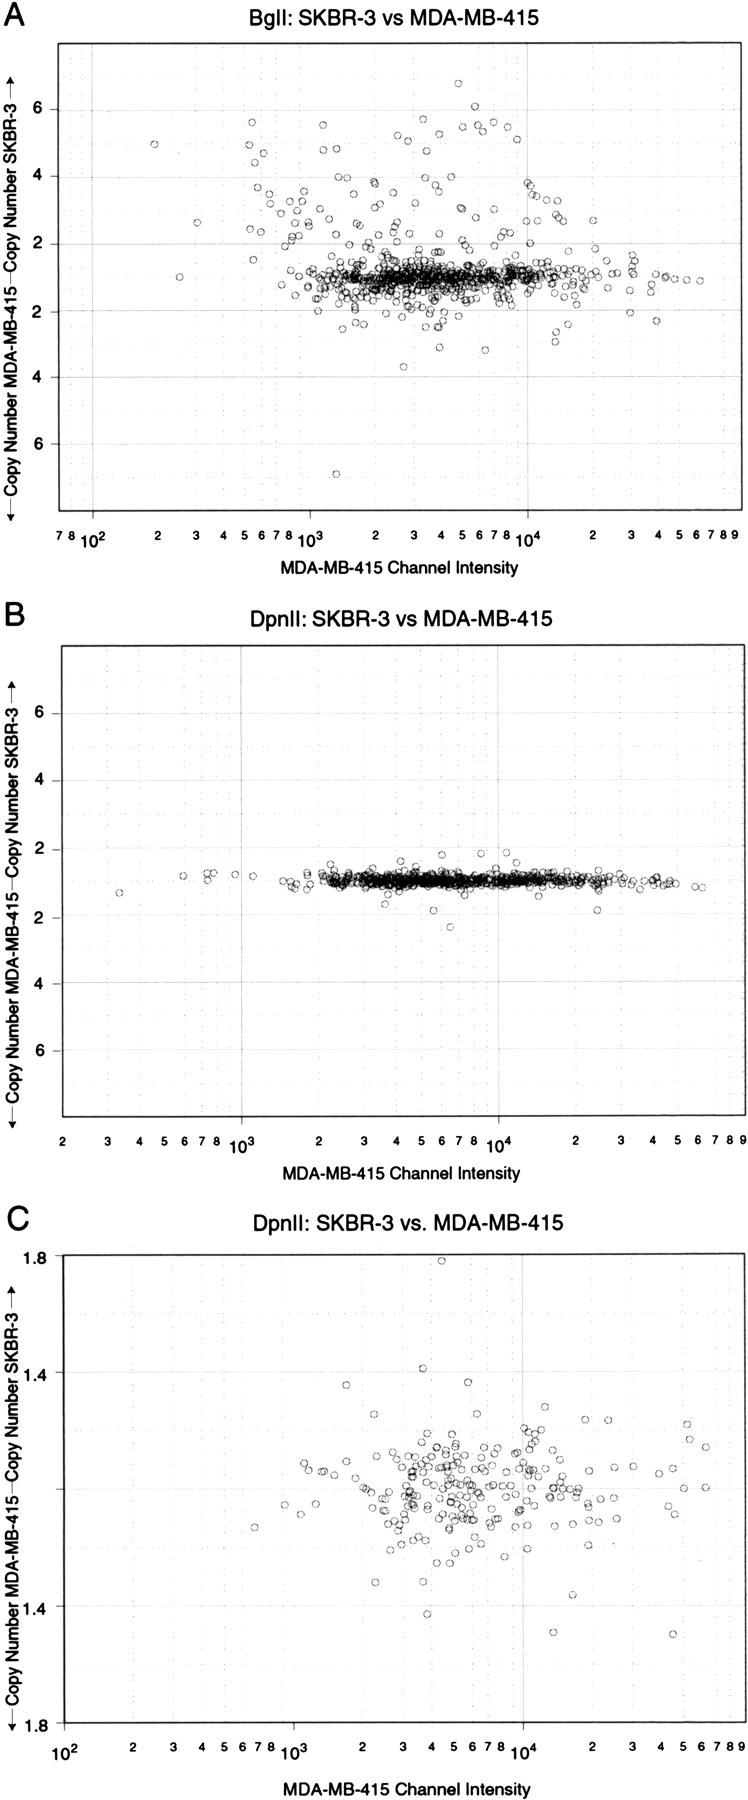
Shows the comparision of hybridizations of BglII representations to that of DpnII representations. Microarrays of 1658 features were hybridized, scanned, and threshed for intensity and the data were graphed in the same format as the data in Figs. 1 A–C, with ratios (or inverse ratios) plotted as a function of single-channel intensity. (A)BglII representations of the two cell lines MDA-MB-415 and SKBR-3 were differentially labeled and hybridized to arrays and graphed as described. (B) DpnII representations of the above cell lines were differentially labeled and hybridized to arrays analyzed and graphed as described. (C) The data from Fig.6B were graphed at a smaller range to show scatter.


