
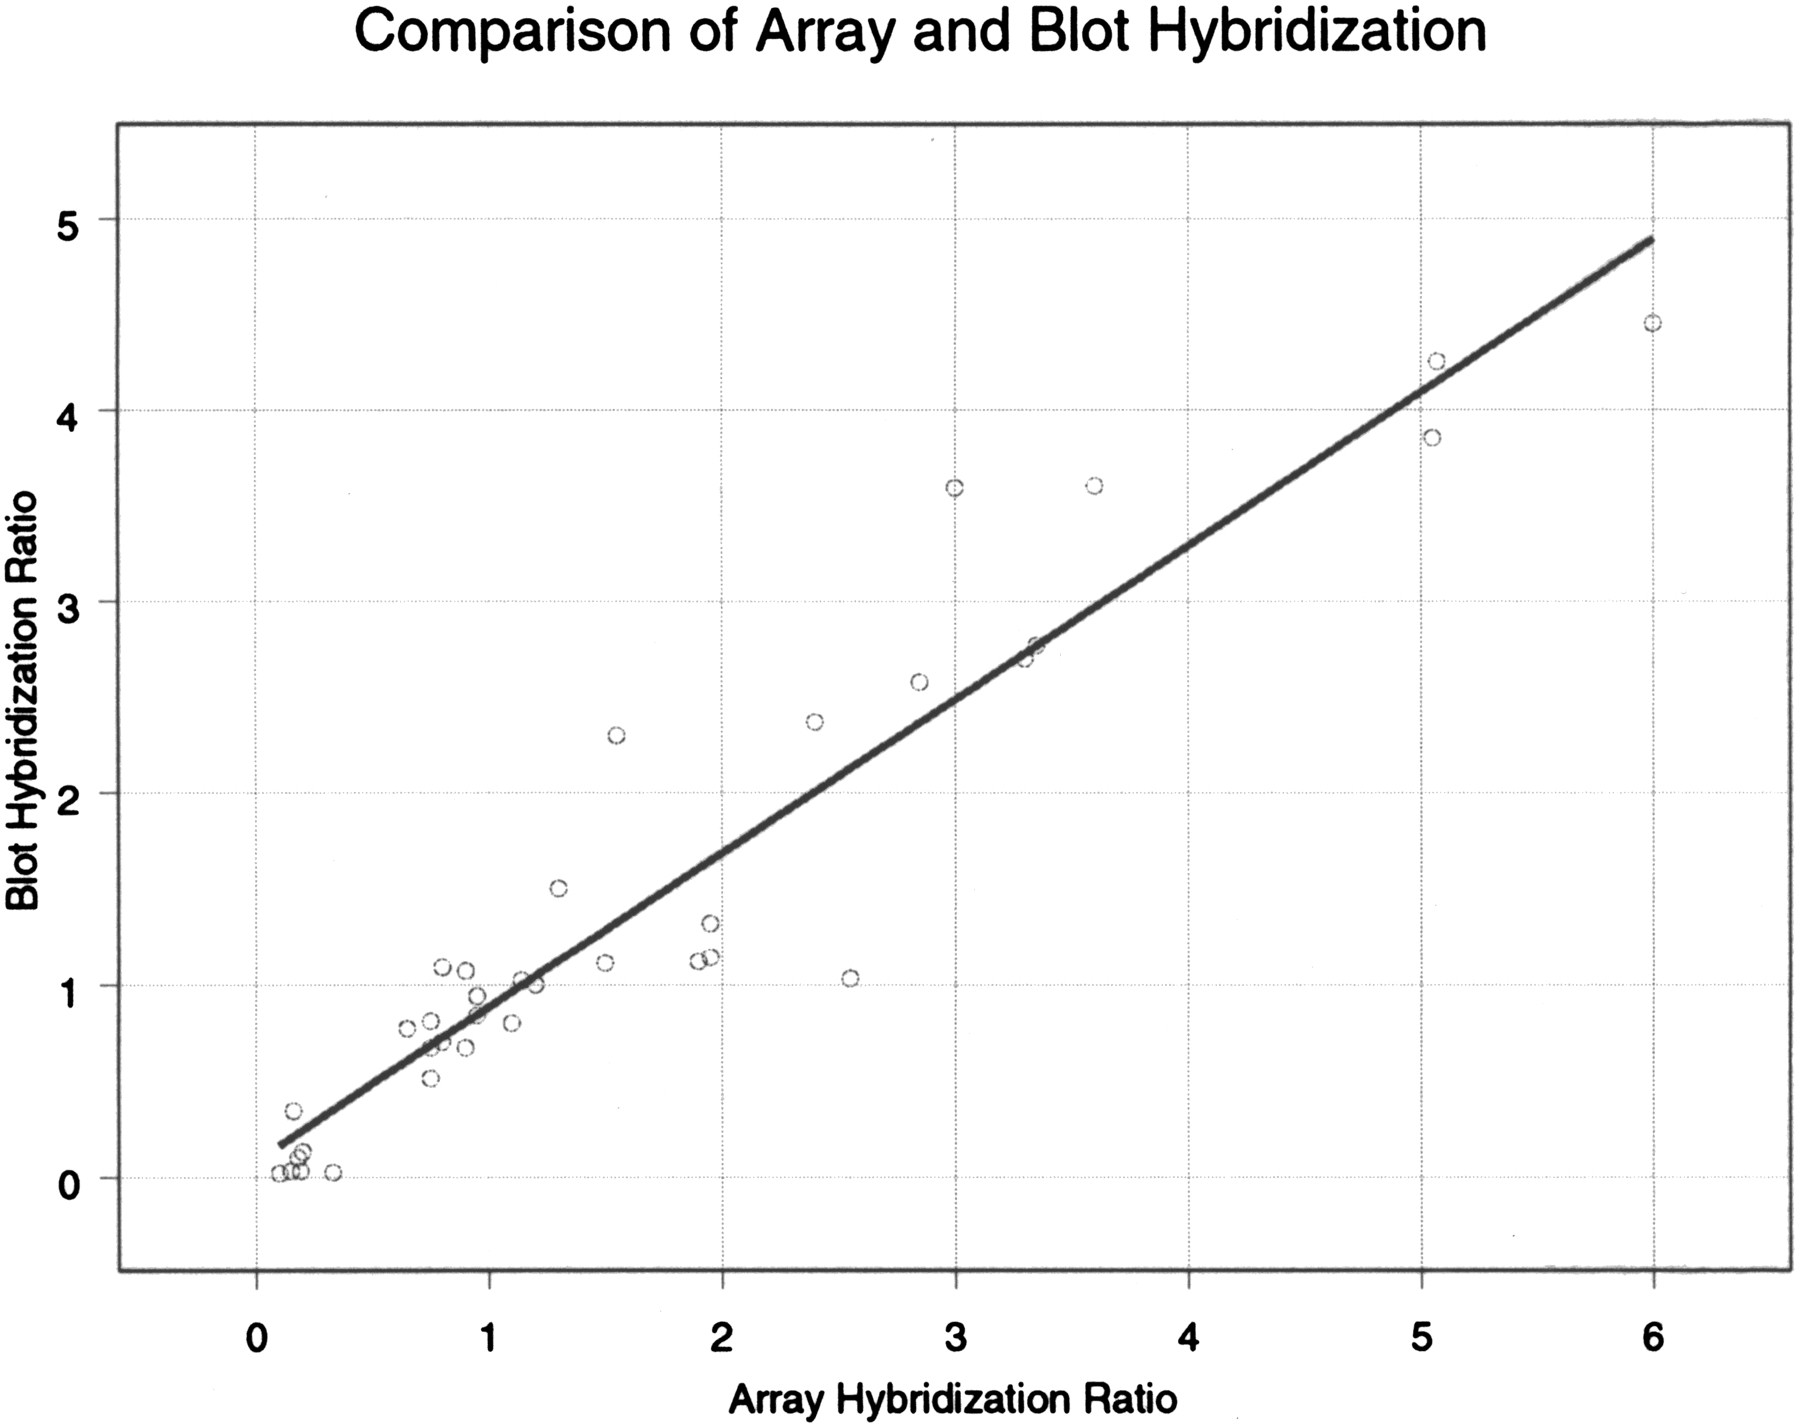
Figure 4.
Shows the ratios of gene copy number obtained by microarray measurement on the X-axis with ratios obtained by quantitative blotting of representations on the Y-axis.
(Downloading may take up to 30 seconds. If the slide opens in your browser, select File -> Save As to save it.)
Click on image to view larger version.
Shows the ratios of gene copy number obtained by microarray measurement on the X-axis with ratios obtained by quantitative blotting of representations on the Y-axis.
 CiteULike
 Delicious
 Digg
Digg Facebook
 Google+
 Reddit
 Twitter
