
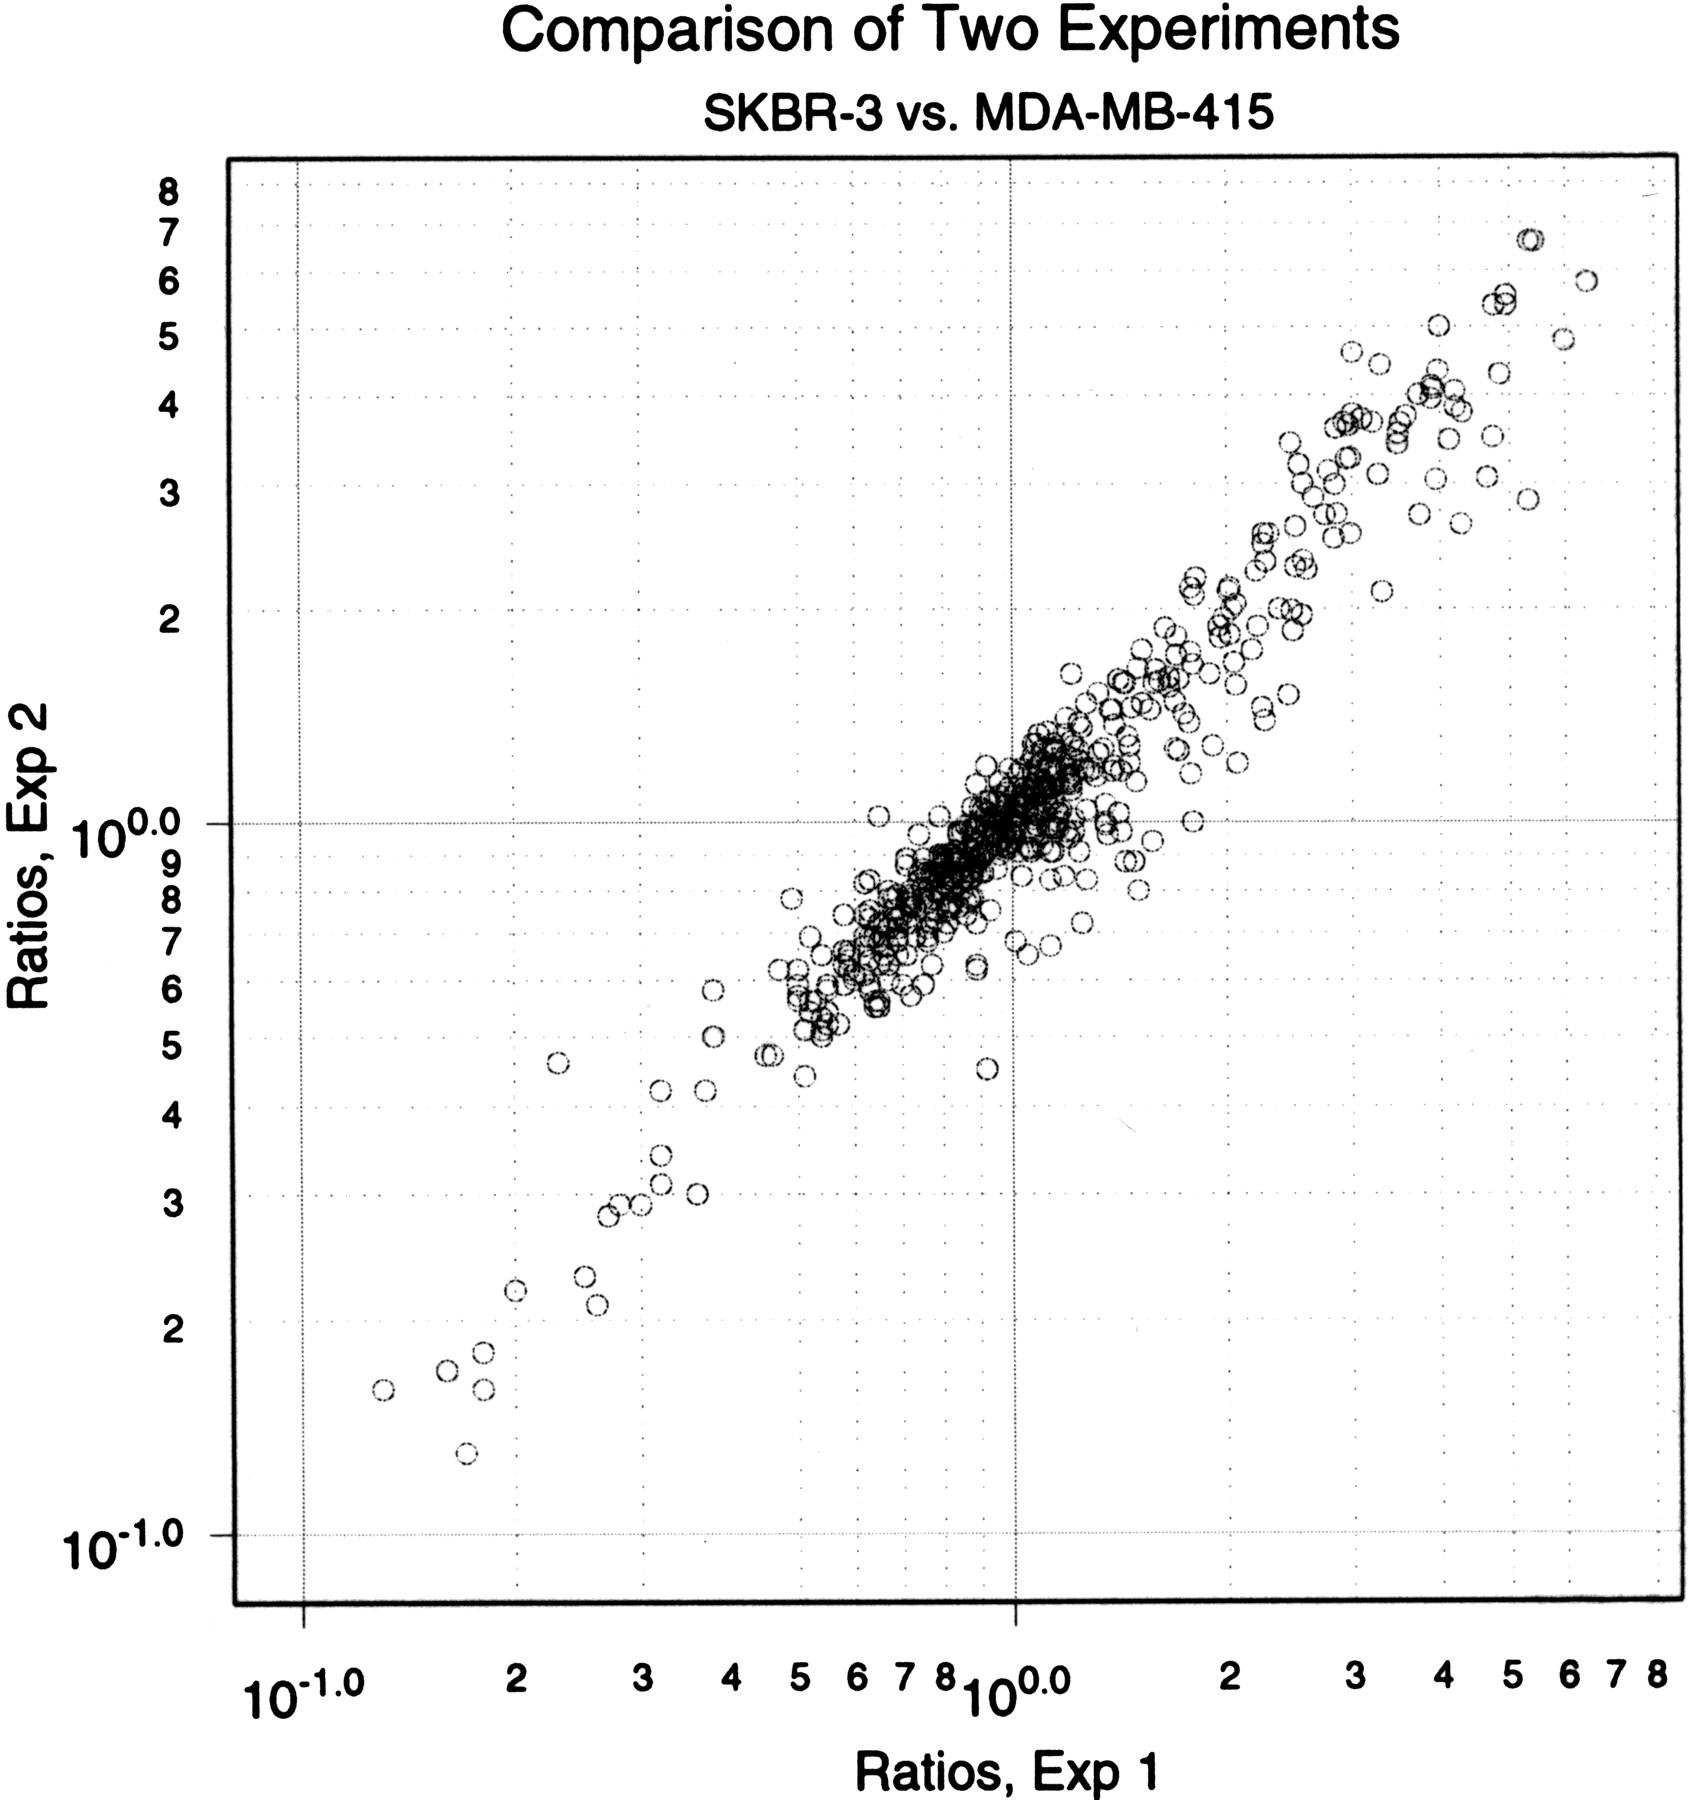
Figure 2.
A comparison of two microarray experiments. Parallel representations were produced for the two cell lines MDA-MB-415 and SKBR-3. These representations were differentially labeled and hybridized to an array of 938 features printed in duplicate. The ratios of duplicates were averaged and then graphed, the abscissa being the ratios from Experiment 1 in ascending order (as an index) and the ordinate being the ratios from Experiment 2 indexed in the same order as the abscissa.


