
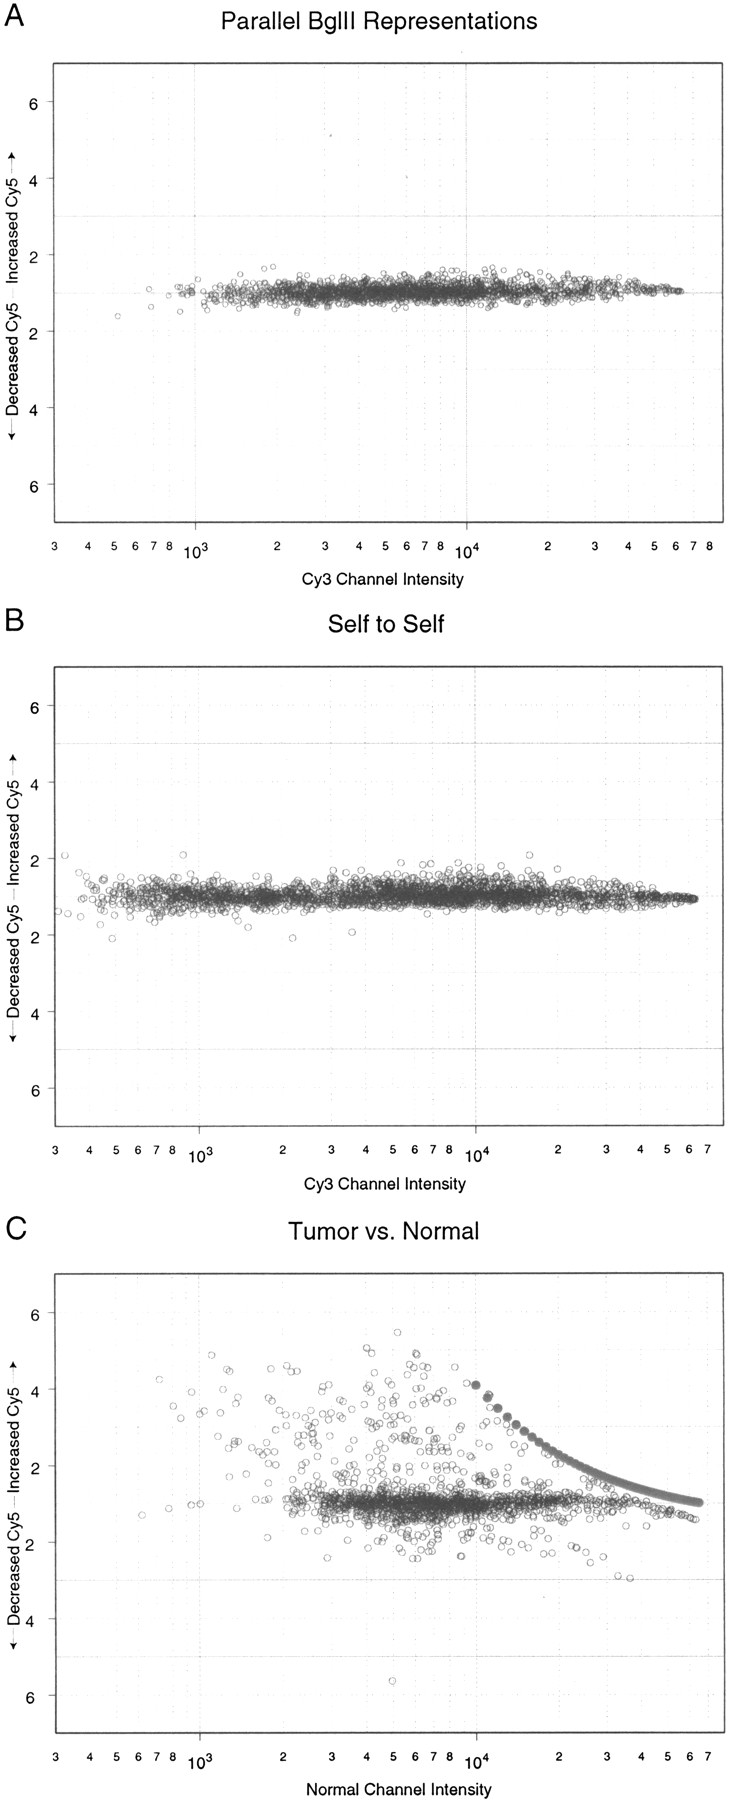
Results of microarray experiments graphed so that the intensity of one channel (usually the Cy3 channel) is the abscissa and the ratio of Cy5:Cy3 is the ordinate. (A) BglII representations were produced separately from the same source of genomic DNA, differentially labeled, and then hybridized to an array of 3316 features (1658 printed in duplicate). (B) One BglII representation was differentially labeled and then hybridized to the microarray described in A. (C) A breast primary tumor was separated into normal and tumor nuclei by sorting, and genomic DNA was prepared. BglII representations prepared from the genomic DNA were differentially labeled and then hybridized to the microarray described in A. Filled circled represent the limit of measurement for the scanner.


