
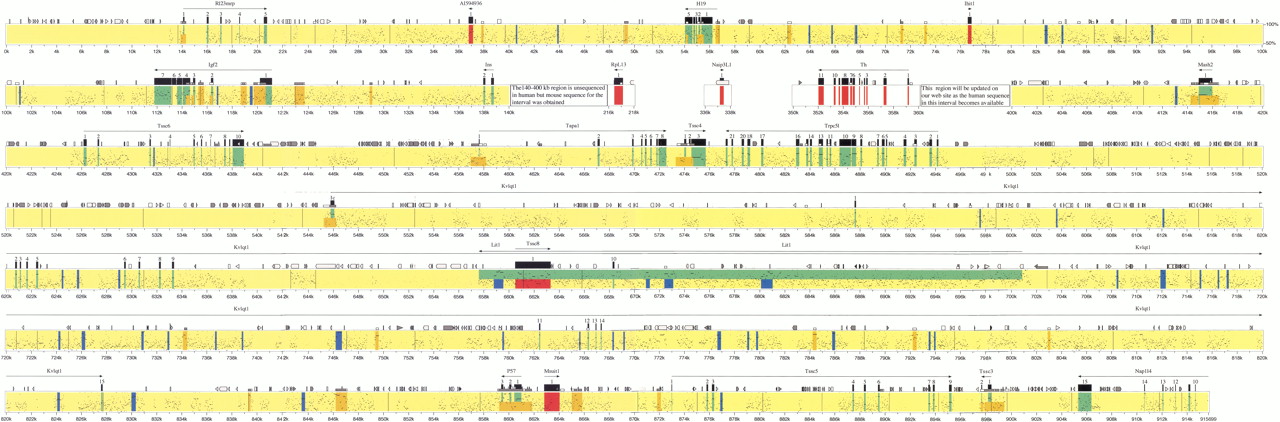
Comparison of mouse and human sequence of the imprinted gene domain. Percent Identity Plot (PIP) showing order and alignment of the entire imprinted domain on mouse chromosome 7 as compared with the orthologous region on human 11p15.5. The mouse sequence is the reference sequence and the short horizontal lines correspond to segments of sequence conservation. Conserved features are color coded as follows: Conserved exons, green; conserved CpG islands, orange; conserved nonexonic sequences not obviously within one of these categories, blue (see text for criteria). Novel genes are shown in red. Where two features apply, two colors are used. The white area is the portion of the human genome sequence that is incomplete but for which mouse sequence was obtained. Vertical black lines show the position of the remaining gaps within the mouse draft assembly sequences. The sequences within these gaps are expected to be <10% (Bouck et al. 1998) of the overall region. Where there is disagreement about nomenclature, exons are numbered arbitrarily (e.g., Igf2).


