
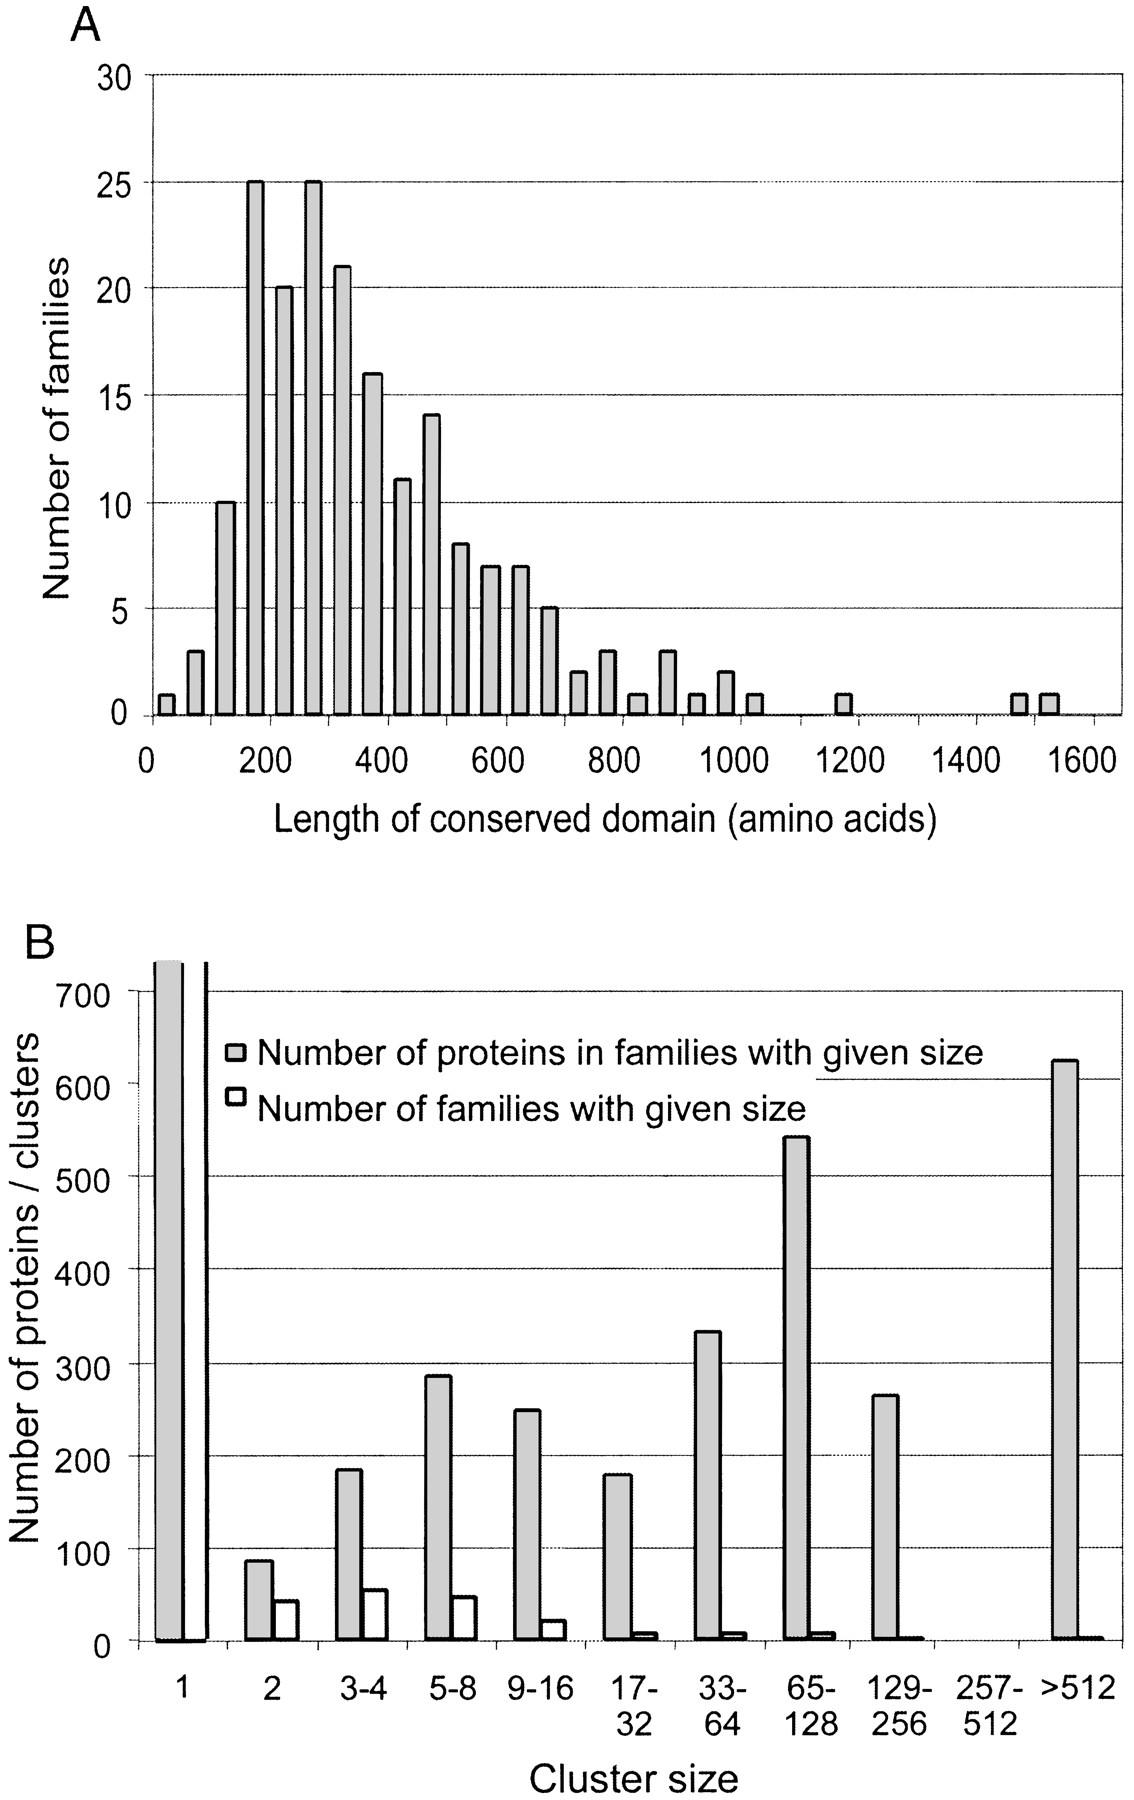
Figure 2.
(A) Distribution of the length of HMMs used in this study. This distribution illustrates the typical length of conserved domains in worm membrane proteins. (B) Paralogous family sizes and distribution of proteins between these families. The X-axis is drawn in logarithmic scale. (Open bars) Cluster distribution by size; (gray bars) the number of proteins belonging to given size of families.


