
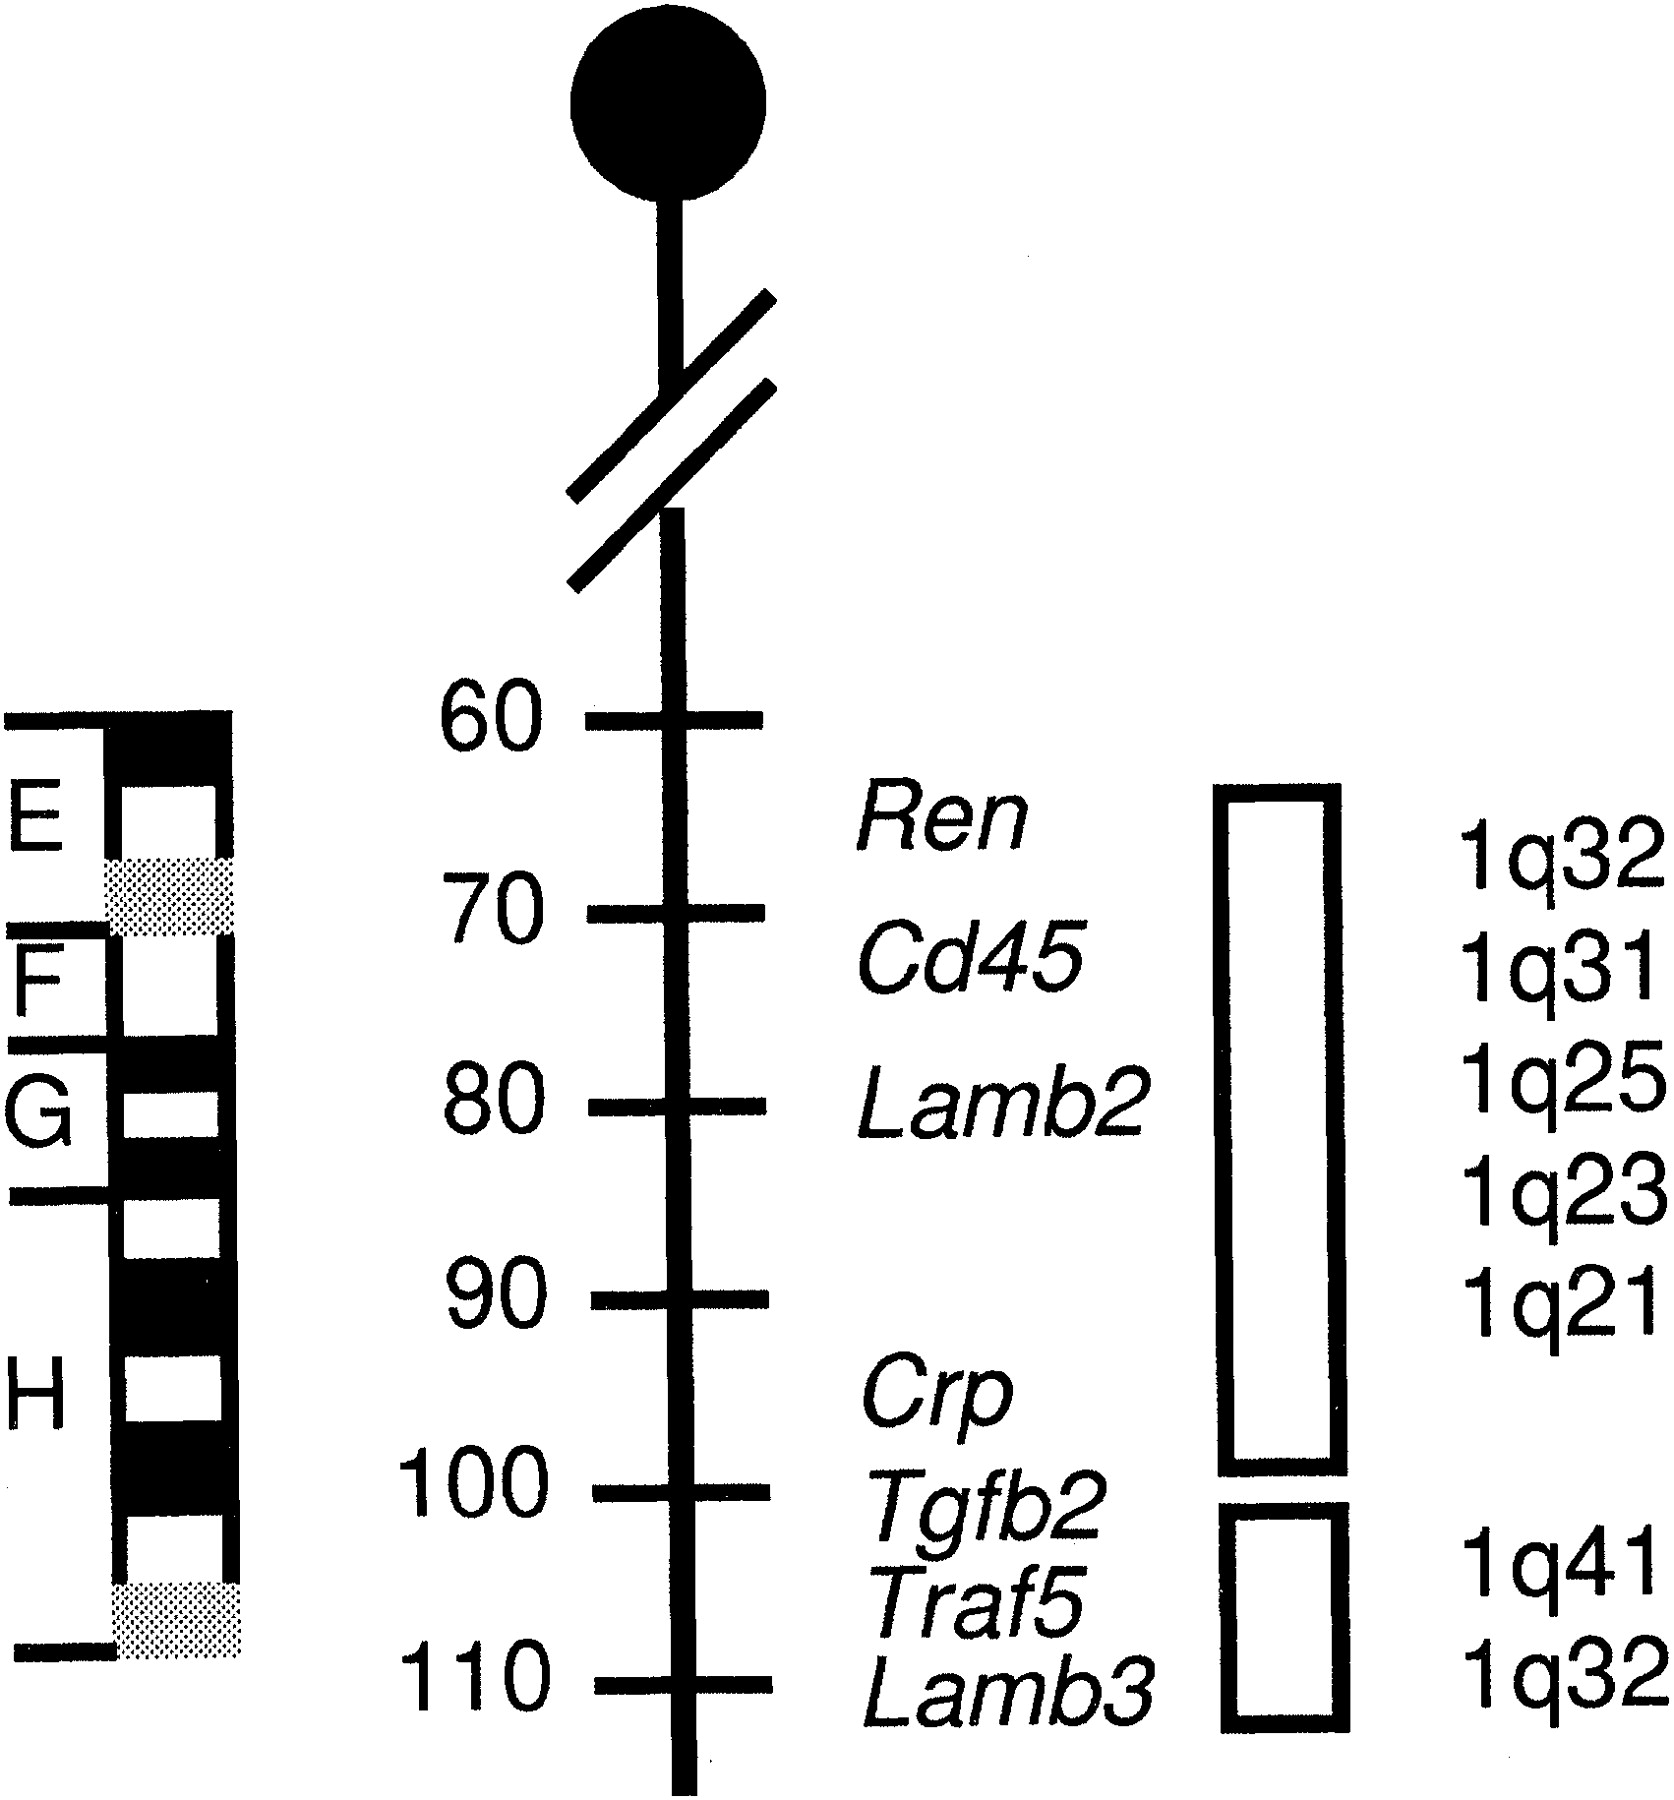
Figure 3.
Mouse synteny map for human chromosome 1q32–q41. Ideogram (left) and genetic map (middle) for the distal end of mouse chromosome 1 are shown. Vertical rectangles at rightrepresent syntenic region at the indicated human chromosome band.


