
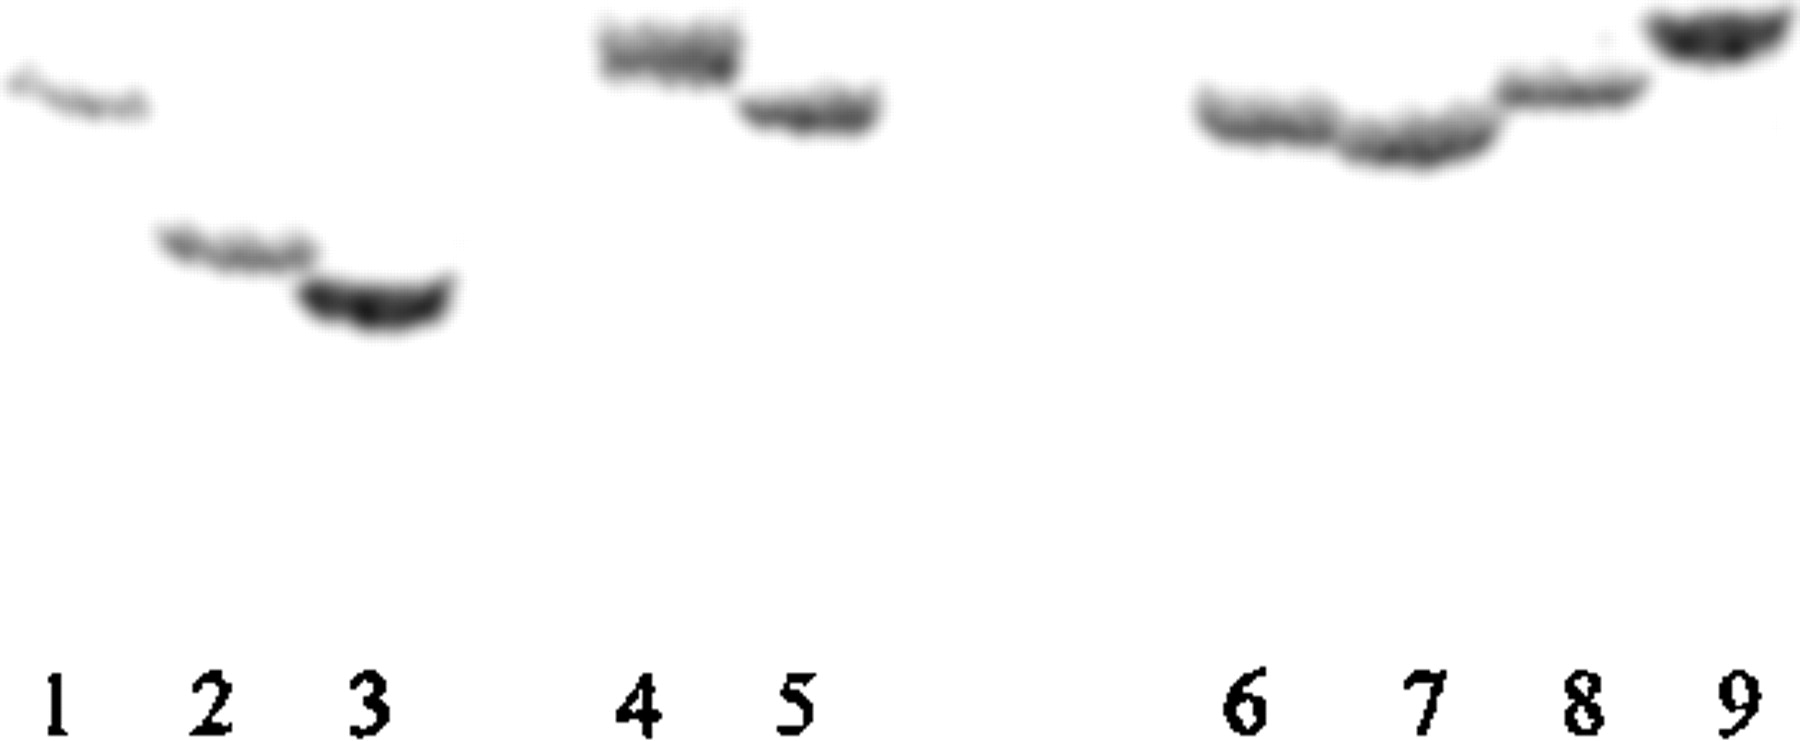
Figure 3.
Mobility differences in PCR products harboring specific SSR tracts among strains of E. coli following electrophoresis in a 5% acrylamide TBE denaturing sequencing gel. PCR was performed using primer pairs, one radiolabeled, flanking the poly(G) tract at a genomic site ∼77 bp upstream from the ATG site of the ycgW locus. The dried gel was exposed to a PhosphorImager. The expected size of theE. coli K12 amplification product was 200 bp. Shown are amplification products for the following strains: (lane 1) K12:DH5α; (lane 2) B:SR9c; (lane 3) B:SR9b; (lane4) ETEC:O78:H [E10407]; (lane 5) EPEC: O111[E639616]; (lane 6) E:1; (lane 7) E:7; (lane 8) E:18; (lane 9) E:47.


