
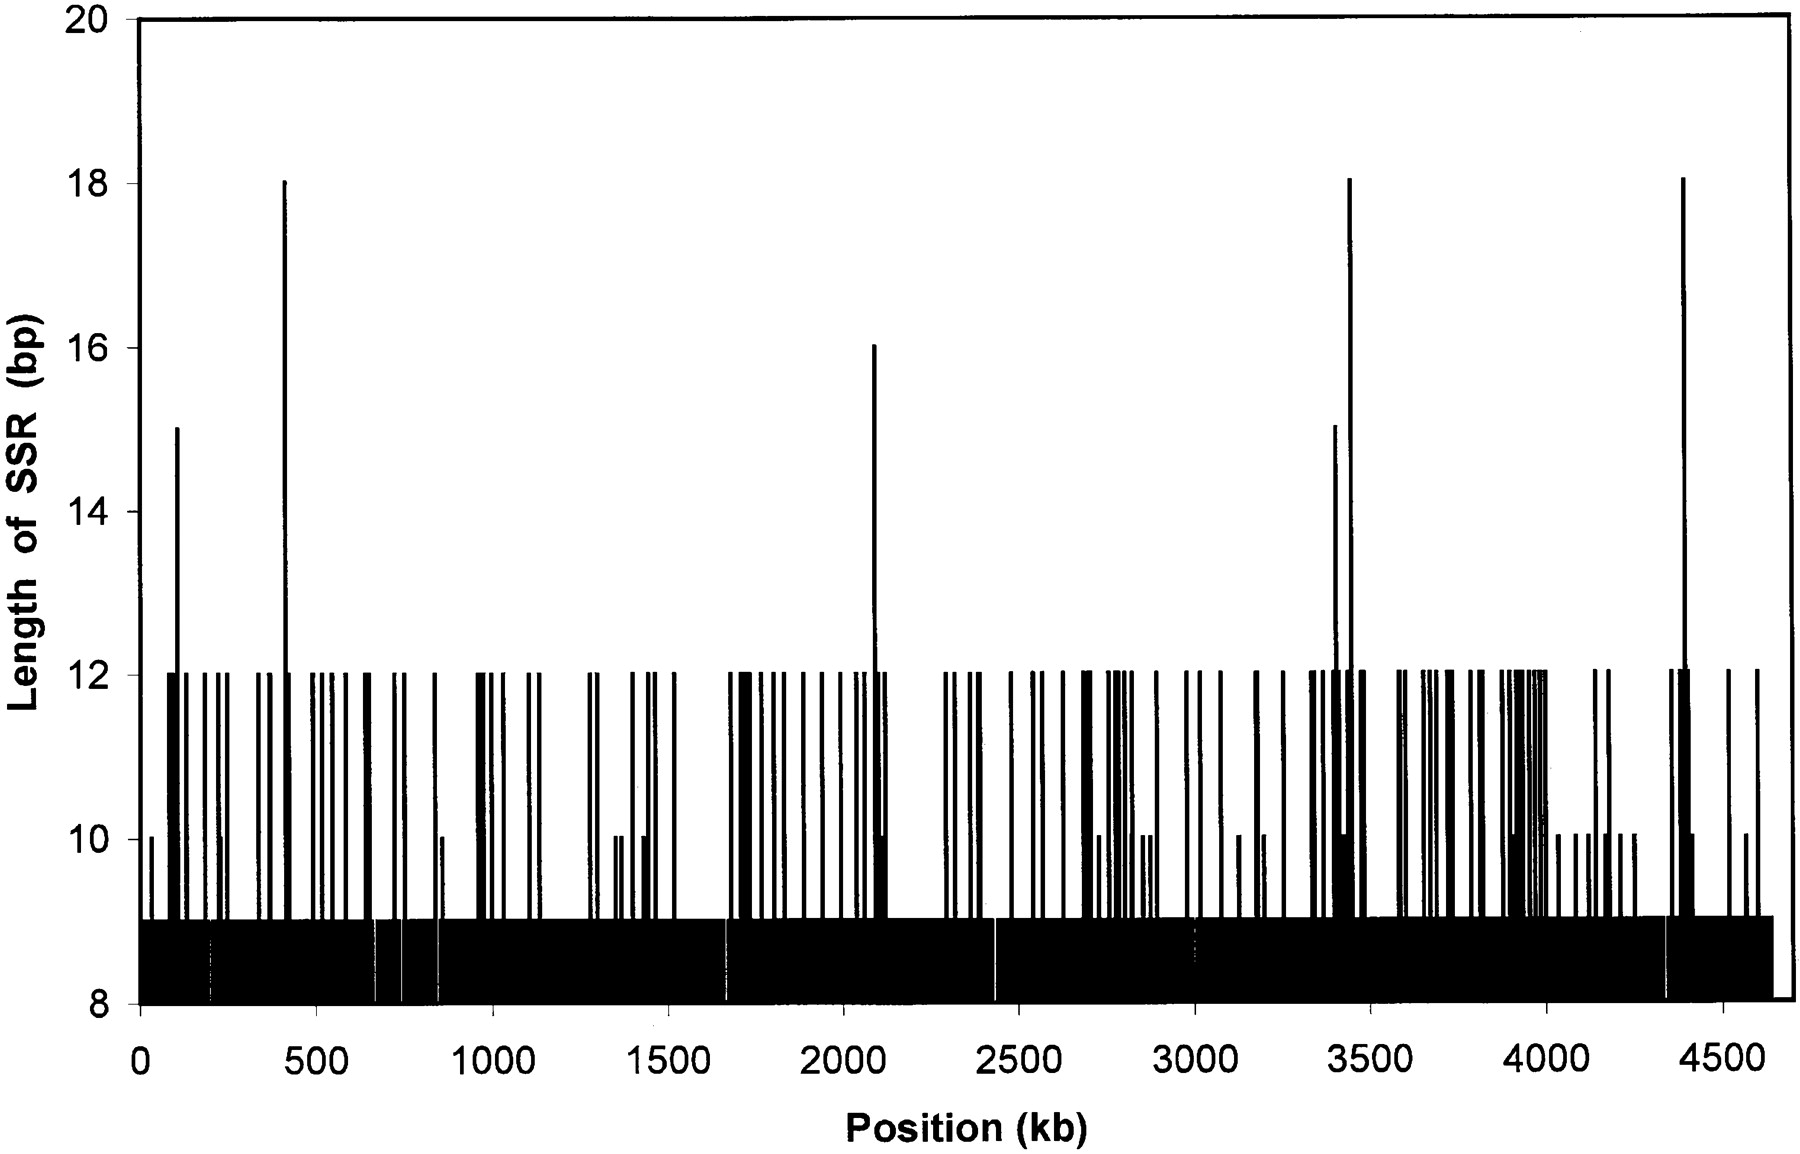
Figure 1.
Abundance, distribution, and lengths of SSR tracts in the E. coli genome, shown as overall length of an SSR tract at a given position in the genome.
(Downloading may take up to 30 seconds. If the slide opens in your browser, select File -> Save As to save it.)
Click on image to view larger version.
Abundance, distribution, and lengths of SSR tracts in the E. coli genome, shown as overall length of an SSR tract at a given position in the genome.
 CiteULike
 Delicious
 Digg
Digg Facebook
 Google+
 Reddit
 Twitter
