

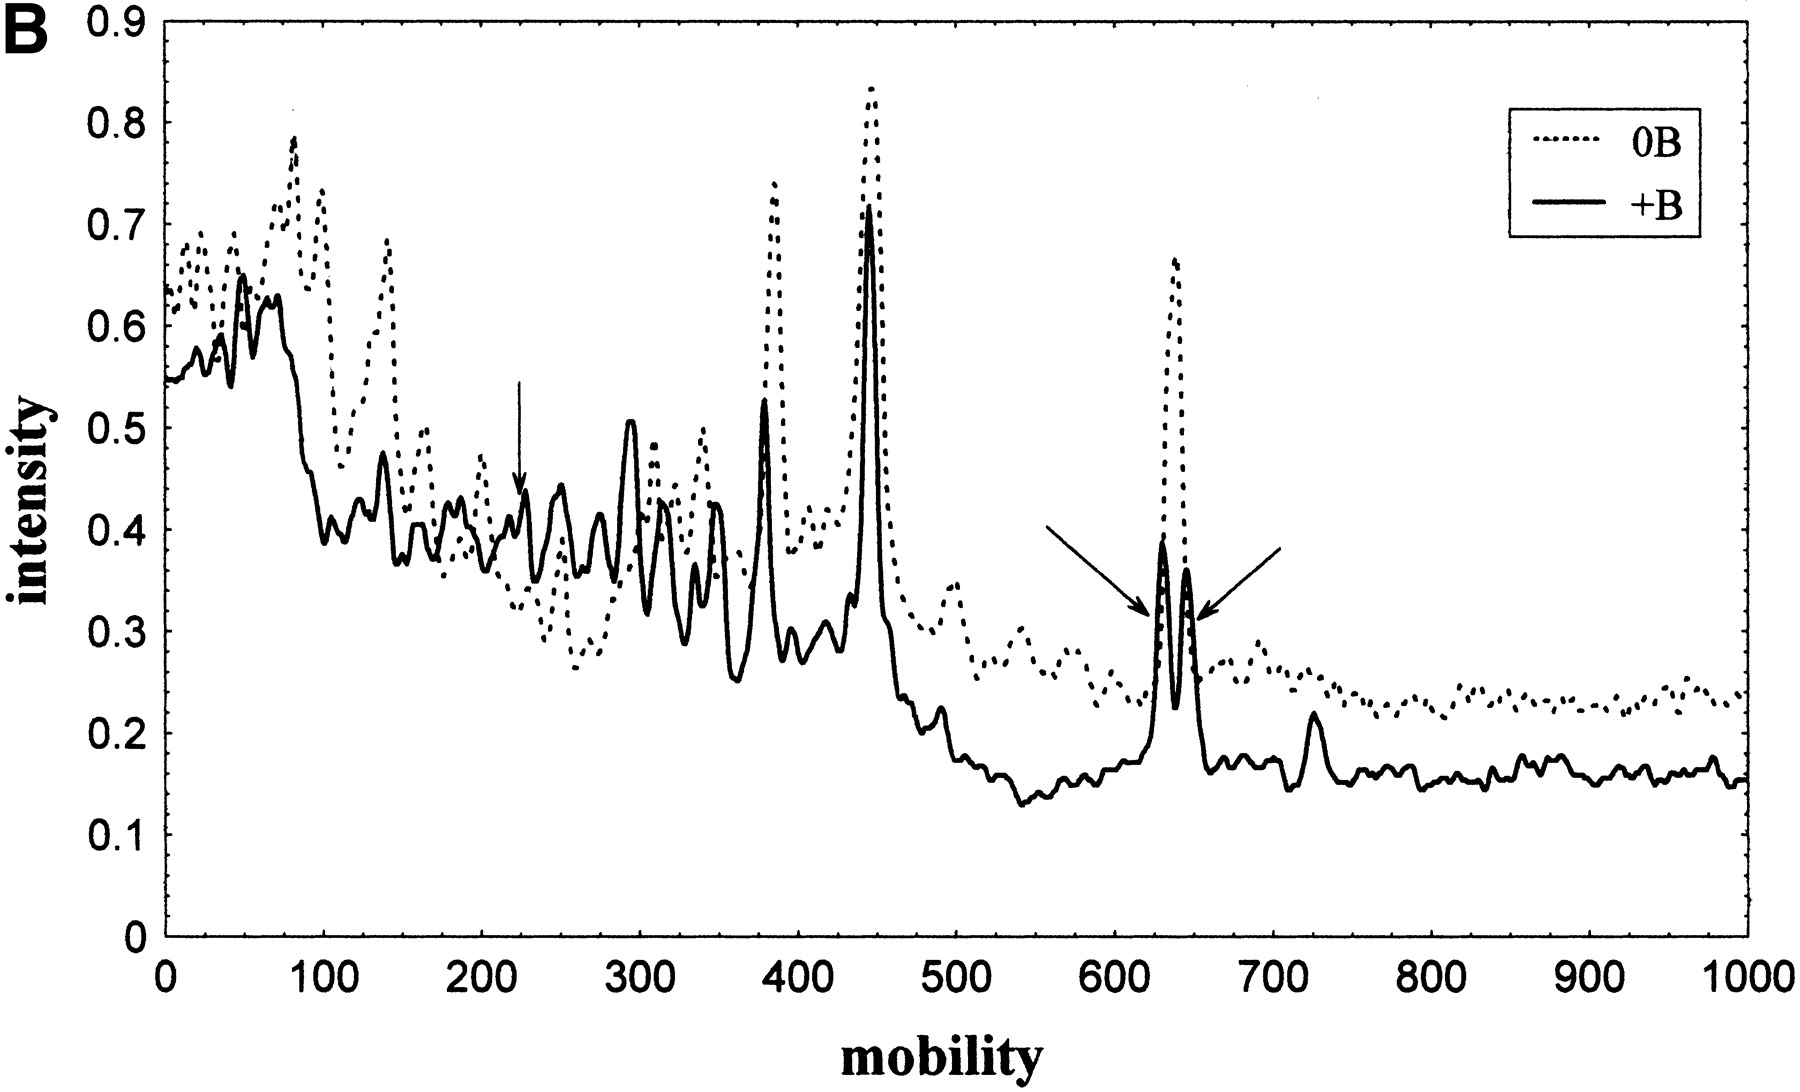
Figure 2.
(A) AP-PCR profile of yellow-necked mice A. flavicollis with Bs (lanes 5–8) and without Bs (lanes 1–4) using c-myc1 amplimer. Profiles were tested at two template concentrations: 50 ng (lanes1,3,5,7) and 250 ng (lanes2,4,6,8). B-specific bands are indicated by arrows. (B) Densitometric scan of 0B and +B amplification profile. Arrows indicate B-specific c-myc1 markers.


