
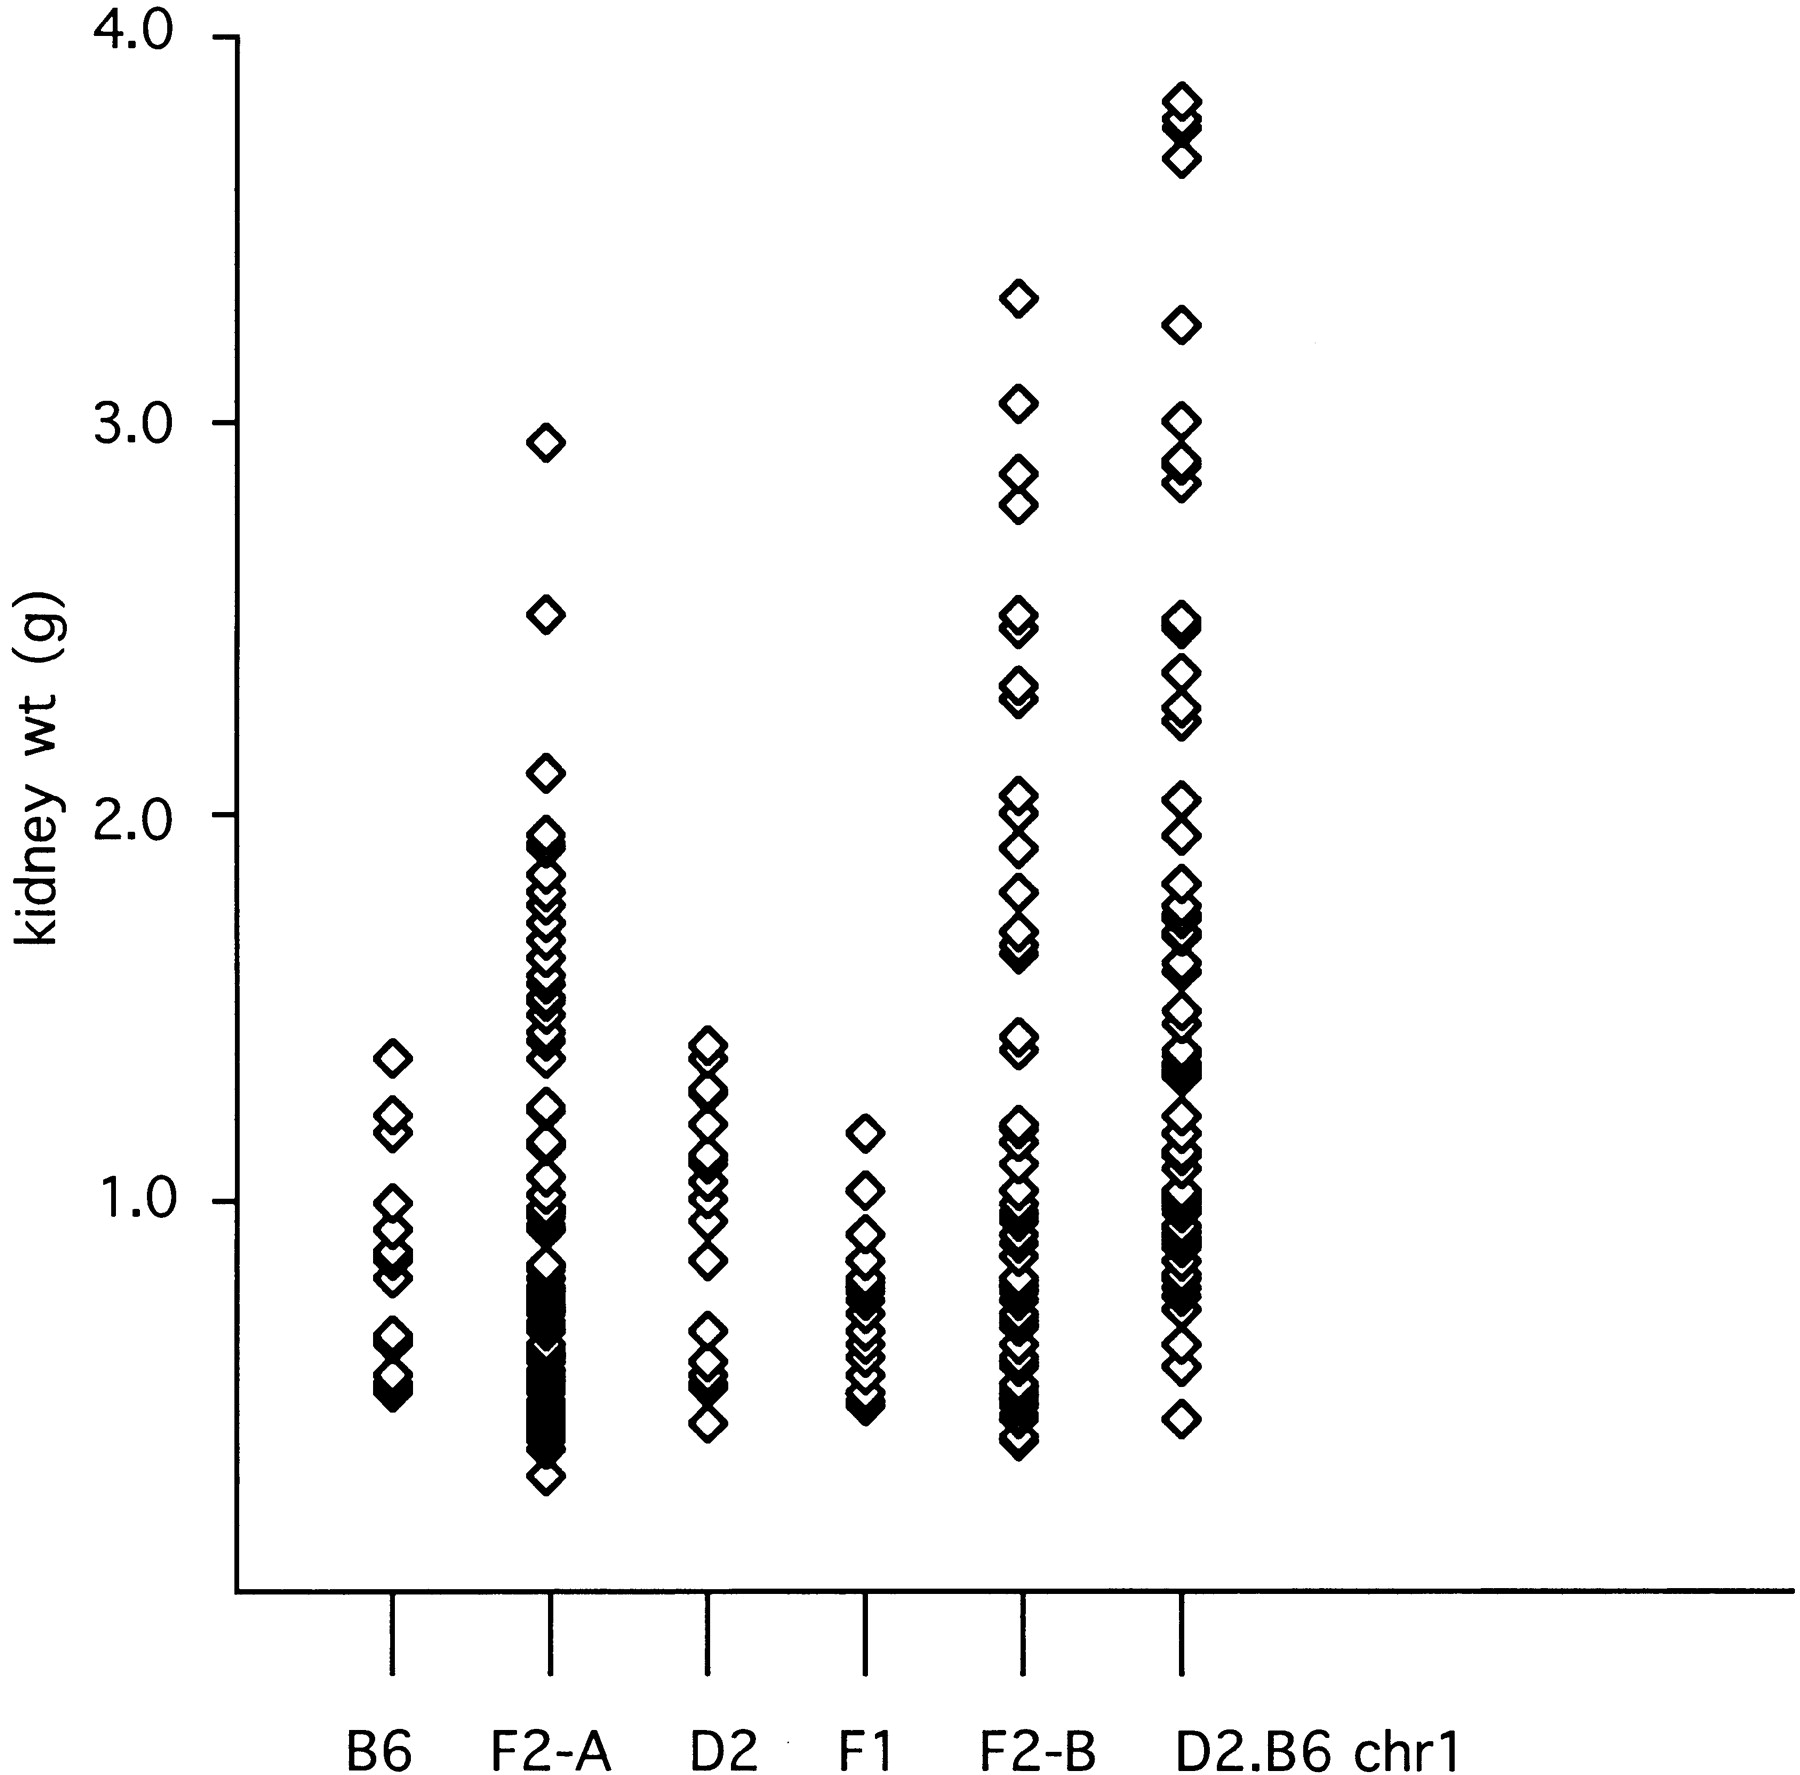
Figure 2.
Scattergram of paired-kidney weight distributions. (B6) Distribution in affected inbred C57BL/6J mice (n = 18). (F2-A) Distribution in affected F2 progeny of a cross between C57BL/6J jck/+ and DBA/2 mice (n = 104). (D2) Distribution in affected DBA/2J jck/+ mice (n = 23). (F1) Distribution in affected F1 progeny of a cross between C57BL/6J jck/+ and DBA/2J jck/+ mice (n = 23). (F2-B) Distribution in affected F2 progeny of a cross between (B6 × D2)F1 jck/+ mice (see Fig. 1) (n = 65). (D2.B6 chr1) Distribution in affected F2progeny of a cross between B6 jck/jck and D2.B6 chr1 congenic mice (n = 67). The data for the B6, F2-A, and D2 cohorts are from Iakoubova et al. (1995).


