
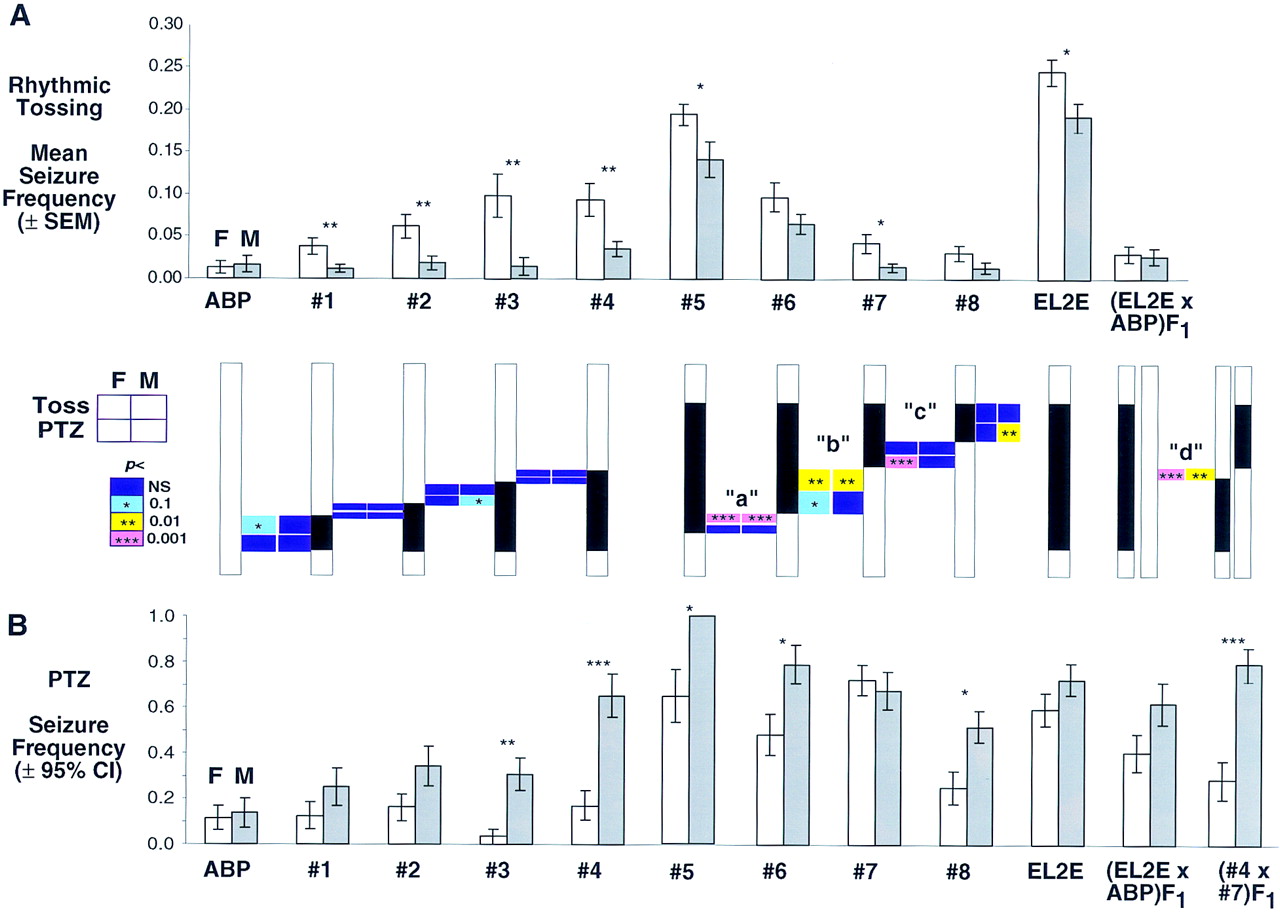
Comparison of seizure frequency utilizing rhythmic tossing. (a) vs. PTZ seizure testing (b), in recombinant strains. The Chromosome 2 area spanned by recombinant strains 1–8, EL2E, and ABP is depicted graphically (actual values given in Table 1), between a and b by a white bar for ABP-like and a black bar for EL-like. Females are shown on the left of each histogram pair (white bar) and males on the right (gray bar). Numbers of animals in each rhythmic tossing group were as follows (F,M): ABP (28,22); 1 (44,47); 2 (22,20); 3 (14,13); 4 (20,31); 5 (22,22); 6 (32,38); 7 (32,22); 8 (30,23); EL2E (59,42); (EL2E × ABP)F1 (16,18). Numbers of animals in each PTZ-tested group were as follows: ABP (35,29); 1 (32,28); 2 (37,29); 3 (29,42); 4 (35,26); 5 (17,12); 6 (21,34); 7 (47,31); 8 (36,25); EL2E (47,40); (EL2E × ABP)F1 (37,29); (4 × 7)F1 (28,29). Pairwise differences in seizure frequency between strains with adjacent recombinations were determined as described in Methods and are represented by quadrants, comparing genders (female, left quadrants; male, right) and seizure tests (rhythmic tossing, top quadrants; PTZ,bottom); significance is depicted by a different color or number of asterisks (dark blue, no asterisk, not significant; light blue, *, P < 0.1; yellow, **, P < 0.01; pink, ***, P < 0.0001). Asterisks above histograms denote within-strain gender differences (same code). The quadrants to theright of strain 8 are from tests in comparison with the ABP/Le strain. Only the bottom quadrants are shown in the pairwise comparison between F1 hybrids because only PTZ was tested in both. Regions defined as a, b, c, and d are described in the text.


